


The LMA International Bodily Injury Index (BII) provides a comprehensive view of bodily injury compensation outcomes across a broad international sample. By applying a consistent set of injury scenarios across multiple jurisdictions, it enables like-for-like comparison of indicative award values and helps track how those values change over time.
The Index is designed to be used by underwriters, claims professionals and risk specialists in managing agents to help in understanding bodily injury exposure across jurisdictions. It does not predict individual claim outcomes; actual claims depend on the specific facts of the case, liability, evidence, policy terms and local procedural requirements.
This overview focuses on interpretation and context. Detailed figures, jurisdiction-level data and scenario-specific analysis are available to subscribing managing agents.
The value of the International Bodily Injury Index lies in its ability to cut through anecdote and provide a consistent, evidence-based reference point across jurisdictions.
– David Fitzpatrick, Chair of the International Liability Business Panel
Purpose and value of the index
The International Bodily Injury Index provides a structured, transparent reference point for understanding how bodily injury awards vary internationally and how the sums awarded evolve over time. By applying consistent scenarios across a wide jurisdictional sample, the Index supports more informed discussion of claims cost trends and their drivers.
The 2024 to 2025 comparison establishes a baseline against which future movements can be assessed, allowing meaningful differentiation between gradual change and genuine structural shifts as the dataset develops over time.
Scope of the index
The BII covers:
- 96 jurisdictions, excluding the US, covering a broad international sample across multiple regions.
- 56 local currencies.
- Eight standardised bodily injury scenarios – from minor injuries to catastrophic injuries and fatal outcomes.
The same claimant profiles and injury definitions are used in every jurisdiction. This standardisation allows differences in indicative award values to be compared across jurisdictions and over time, where data is available.
All figures are shown in local currency to reflect how awards are assessed and settled in practice within each jurisdiction.
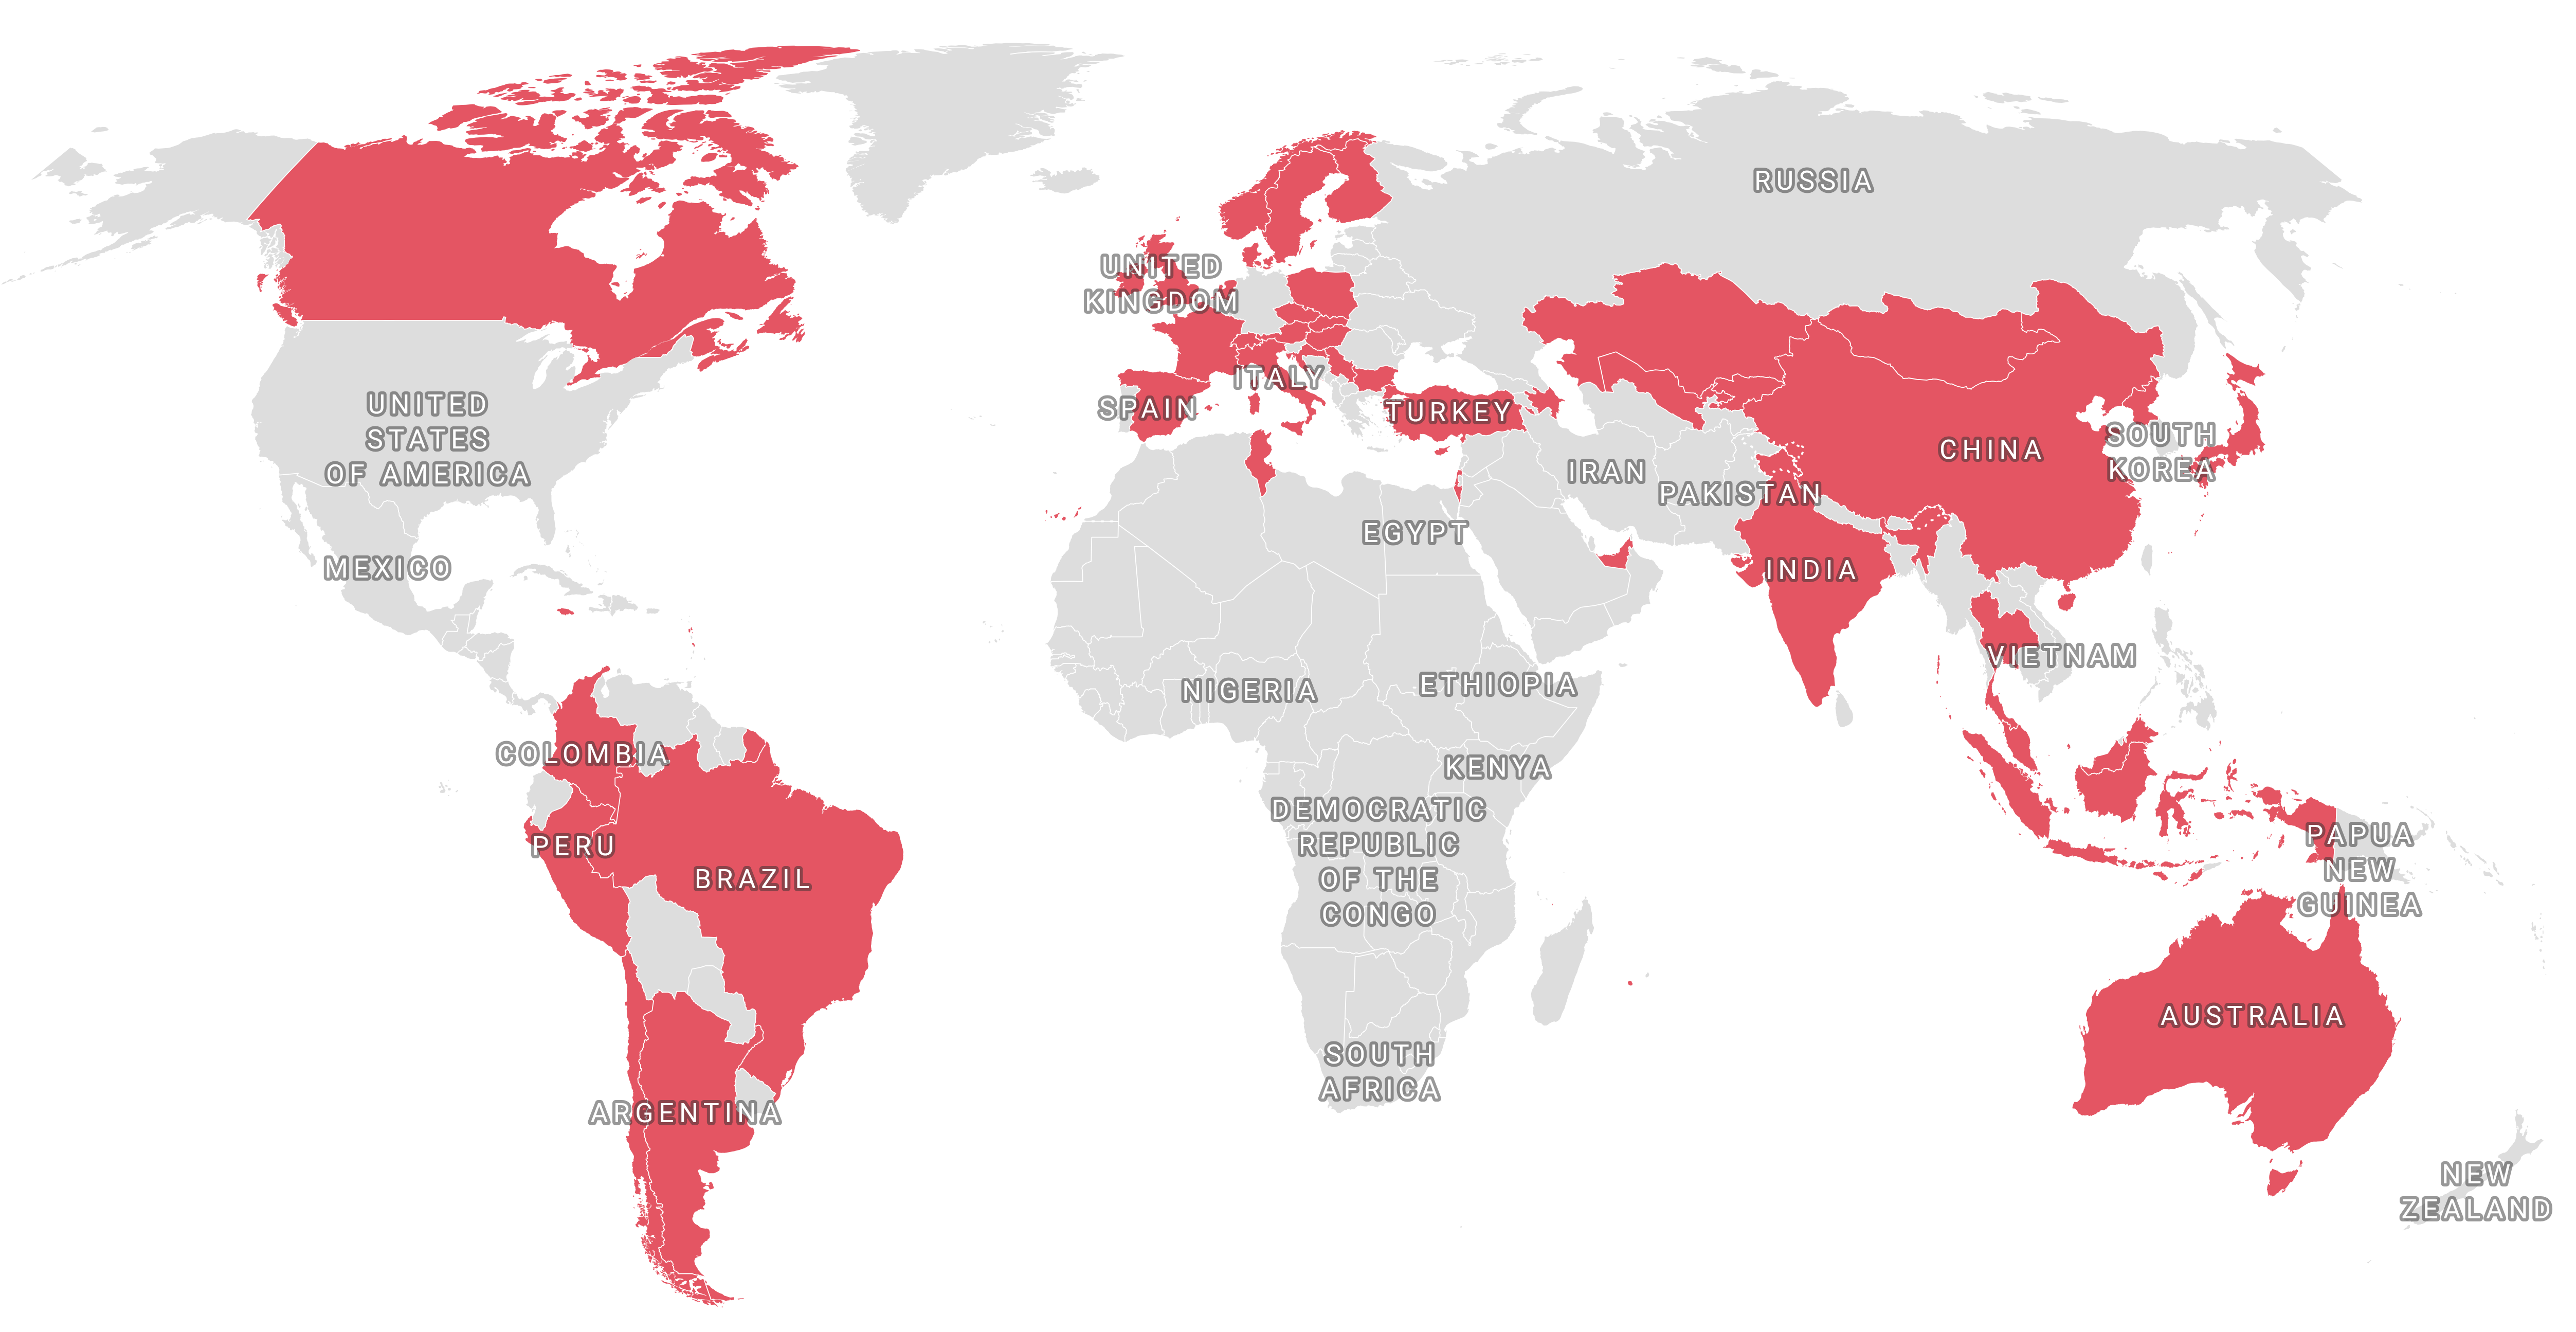
Figure 1 note: Jurisdictions not shown may still be included in the Index but do not have complete data for both years yet.
Data availability and interpretation
The Index prioritises transparency and comparability. As a result, not every jurisdiction has complete data across every scenario and year.
Year-on-year analysis is based only on like-for-like comparisons, meaning jurisdictions where the same scenario has values in both 2024 and 2025.
What the data shows from 2024 to 2025
Data note
This analysis reflects the dataset as at 15 January 2026 and is based on jurisdictions with values available in both 2024 and 2025 at that time. The Index is updated periodically as additional jurisdictional data becomes available. Subsequent updates may expand the like-for-like sample and refine the distribution of movements.
Coverage for year-on-year analysis
Across the eight scenarios, between 59 to 60 jurisdictions currently have values available in both 2024 and 2025, depending on data availability for the specific scenario. These jurisdictions form the basis for year-on-year movement analysis.
Typical year-on-year movement
Across jurisdictions where values are available in both 2024 and 2025 (the like-for-like set used for year-on-year comparison), the median year-on-year change is modest:
- Minor or superficial injuries: increase of 1%.
- Broken limb injuries: increase of 1%.
- Serious and catastrophic injuries (including amputation, loss of sight, psychiatric injury, brain injury and paralysis): increases typically between 2% and 3%.
- Fatal outcome scenario (full awareness of death): increase of 3%.
The distribution shows that most jurisdictions experienced incremental, rather than dramatic movement, between 2024 and 2025. However, a small number of jurisdictions show more pronounced year-on-year movements. Ten to fifteen jurisdictions fall into the “large increase” band (more than 10% year-on-year), depending on the scenario.
For example, in the minor or superficial injuries scenario, jurisdictions such as Uzbekistan and Japan show large year-on-year increases, while in the paralysis scenario, large movements are seen in jurisdictions such as the UAE and Jamaica. These larger shifts are typically linked to discreet local developments, such as legislative change, court practice shifts or updated valuation reference points.
Distribution and variability
Although median movements are low, the distribution of outcomes is wider for some scenarios. Interquartile ranges vary materially, particularly for minor injuries and paralysis. This reflects differing local dynamics rather than a uniform global trend.
Across scenarios, a significant proportion of jurisdictions show no year-on-year change at all. Depending on the scenario, between 15 and 25 jurisdictions remain unchanged within the like-for-like sample.
Direction of change
Increases are more common than decreases, but decreases do occur:
- In minor injury scenarios, 53% of jurisdictions showed increases, 5% decreased and 42% were unchanged.
- In fatal outcomes scenarios, 64% increased, 5% decreased and 31% were unchanged.
This demonstrates that bodily injury awards are not moving uniformly in a single direction across all jurisdictions.
The charts below are derived from the International Bodily Injury Index. They illustrate high-level patterns and do not display detailed figures or jurisdiction-level values. The two charts present complementary views of year-on-year movement. Figure 1 shows the scale of change by grouping jurisdictions into movement bands, while Figure 2 shows the overall direction of movement across jurisdictions.
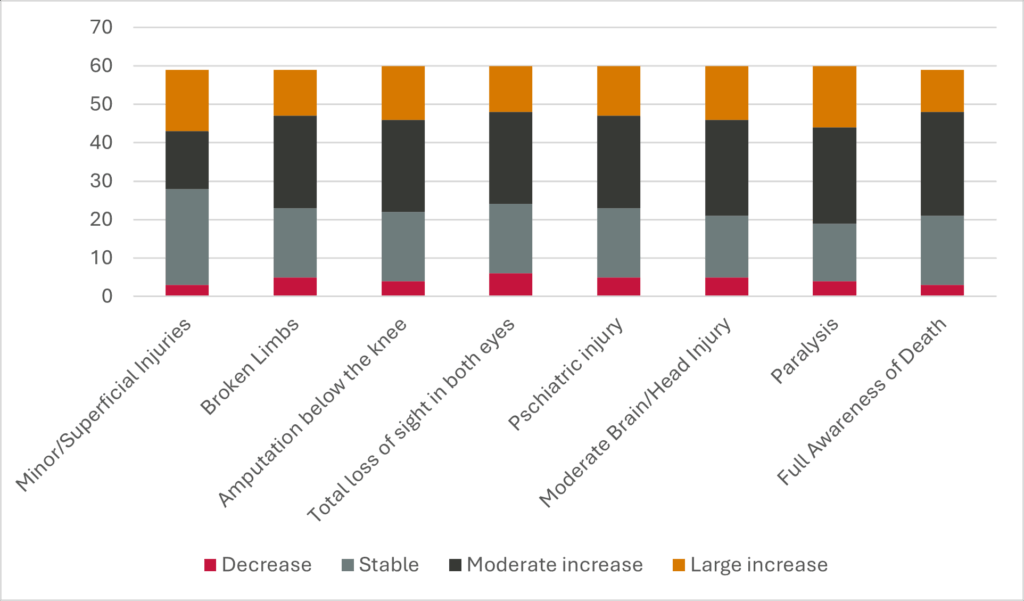
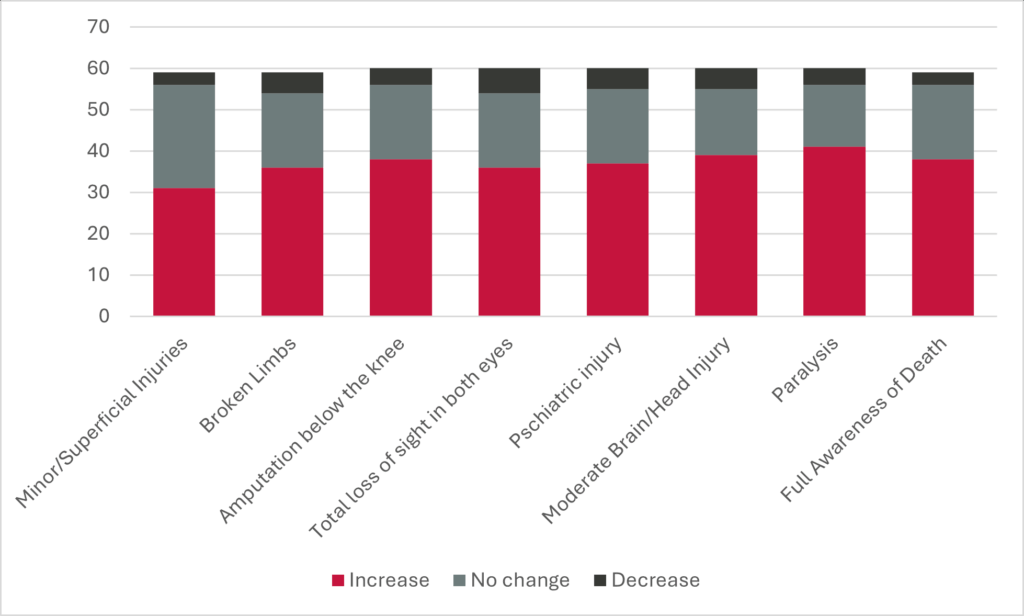
Figure 2. Distribution of year-on-year movements by injury scenario
(like-for-like jurisdictions only)
Figure 2 note: For each scenario, jurisdictions are grouped into bands based on the year-on-year percentage change between 2024 and 2025 in the indexed award value, for like-for-like jurisdictions only. Decrease means values decreased year-on-year. Stable means 0% change. Moderate increase means an increase greater than 0% and up to 10%. Large increase means an increase greater than 10%.
Figure 3. Direction of year-on-year change by injury scenario
(like-for-like jurisdictions only)
Figure 3 note: For each scenario, jurisdictions are categorised based on the year-on-year movement between 2024 and 2025 in the indexed award value, for like-for-like jurisdictions only. Increase means values increased year-on-year. No change means values were unchanged. Decrease means values decreased year-on-year.
What the data shows is not a single international story, but a pattern of stability for many jurisdictions alongside targeted areas of change driven by local legal and economic factors.
– Chris Mather, Senior Executive, Technical Underwriting at the LMA and Secretary of the International Liability Business Panel
Step changes and outliers
As set out above while the median year-on-year changes are modest and most jurisdictions fall within the stable or moderate movement bands, a smaller group falls into the “large increase” band, defined as movements of more than 10% year-on-year.
Examples observed in the data include:
- In a small number of jurisdictions, year-on-year movements fall into the “large increase” band (more than 10% year-on-year), representing a minority of the like-for-like set. These more pronounced shifts tend to be concentrated in higher-severity scenarios and are more consistent with discrete local developments than with gradual inflation.
- Larger step changes are more commonly seen in higher-severity scenarios (for example, paralysis and amputation) where local valuation frameworks can shift materially.
- Decreases are less common than increases and are limited to a handful of jurisdictions per scenario, with some of the more notable decreases appearing in minor or superficial injury scenarios.
These outliers can skew the overall average when year-on-year percentage changes are summarised across jurisdictions. The analysis compares two figures per jurisdiction (2024 and 2025) and calculates a year-on-year percentage change for each jurisdiction in the like-for-like set. These jurisdiction-level percentage changes are then summarised across that set. To avoid distortion from outliers, this overview presents the median and the distribution
of movements rather than relying on a single average figure. Larger shifts may also point to discrete local developments, such as legislative change, shifts in court practice, updated damages guidelines and valuation reference points, influencing outcomes in particular jurisdictions.
Why this is significant
Stability is itself a finding
The data shows that international bodily injury awards are not experiencing uniform escalation year-on-year. Across scenarios, between 15 and 25 jurisdictions show no year-on-year change within the like-for-like samples. For example, 42% of jurisdictions remain unchanged in the minor injury scenarios and 31% unchanged in the fatal outcome scenario. In an environment where social inflation is often discussed in broad terms, the Index demonstrates that the reality is more uneven and jurisdiction specific.
Inflationary pressure is local, not universal
Where increases occur, they are unevenly distributed. The concentration of changes within specific jurisdictions suggests that local legal frameworks, court practice, economic conditions and claims environments are the primary drivers of movement rather than a single international trend.
Step changes indicate structural shifts
Large year-on-year movements in a small number of jurisdictions are more consistent with structural changes than with gradual inflation. For example, in the paralysis scenario, a small number of jurisdictions show year-on-year increases of more than 100%, including the UAE, Uzbekistan and Jamaica. Isolated decreases also occur, particularly in the minor or superficial injury scenario, for example, China and Queensland, Australia.
Direction of travel matters
The presence of decreases and unchanged values alongside increases demonstrates that bodily injury awards are not a one-way ratchet. They can stabilise or fall as well as rise, depending on local conditions.
Limitations and context
The scale of the Index is a strength, but it requires careful interpretation:
- Blank fields reflect unknown data, not a 0 value.
- Figures are indicative benchmark estimates, not claim predictions, developed through specialist legal input and jurisdictional insight.
- Local context remains essential and is captured through jurisdiction-specific notes where available.
- The Index is not a pricing or reserving tool and should not be used as a substitute for claim-specific analysis.
- The Index is not intended to set market benchmarks, tariffs or pricing levels, nor to replace jurisdiction-specific legal advice.
Key definitions
Bodily injury scenario
A standardised, injury outcome used consistently across all jurisdictions. Each scenario is based on the same claimant profile and injury description to support comparability.
Like-for-like comparison
A comparison between years that includes only jurisdictions where a value is available for the same scenario in both 2024 and 2025. Jurisdictions without data in one of the years are excluded from year-on-year analysis for that scenario.
Year-on-year (YoY) change
The percentage change between the 2024 and 2025 indicative values for the same scenario and jurisdiction. Year-on-year analysis is calculated only on a like-for-like basis.
Local currency
Indicative values are shown in the currency used within each jurisdiction. Figures are not converted into a single reference currency to avoid masking local economic and legal dynamics.
Blank data field
A blank field indicates that the relevant value is unknown or unavailable for that jurisdiction and year. It does not mean that the value is zero or that no award is payable.
Indicative value
A benchmark figure reflecting informed market understanding for a defined scenario. Indicative values are not claim outcomes and should not be interpreted as pricing, tariffs or guaranteed awards.
Jurisdiction
A country or legally distinct legal system included within the Index. In some cases, (for example, Australia and Canada, we have dealt with different states within the country as their rules and awards can differ materially.)
Methodology (how year-on-year movement is calculated)
Year-on-year movement is calculated using the LMA International Bodily Injury Index’s standardised scenarios, comparing 2024 and 2025 values on a like-like basis. For each scenario, jurisdictions are included only where values are available in both years.
The year-on-year percentage change is calculated as:
Subscribe to access the full dataset
Subscribing managing agents receive full access to the Index, including:
- Scenario-level data and jurisdiction-specific insights.
- Like-for-like year-on-year comparisons and distribution metrics.
- Tools to support deeper assessment of bodily injury exposure and emerging trends.
To request access, please contact Chris Mather, Senior Executive, Technical Underwriting at the Lloyd’s Market Association.