


Executive summary
This paper examines the use of indexation in the review of portfolio trackers and documents methods to measure it. Currently, there is no universally accepted market standard for measuring indexation. As heightened attention has been placed on the performance of portfolio trackers, it is becoming increasingly important to accurately report and be able to compare indexation across facilities so that targeted action can be focused on areas that require it most. It can also form part of contractual arrangements between a portfolio tracking coverholder and underwriters, enhancing the need for calculations to be accurate and transparent. The following discussion suggests a framework for measuring indexation that could be adopted by underwriters and coverholders if thought appropriate.
What is indexation?
Portfolio trackers are supposed to ‘track’ or ‘index’ an entire portfolio of risks, sometimes across many classes of business. Indexation is a measure used to track how well capacity is being deployed across a portfolio. Indexation can also be used to detect anti-selection, i.e. where capacity is more likely to be deployed behind hard-to-place/lower performing risks as opposed to being deployed across all in scope risks. It is not relevant for coverholders operating other follow facilities in which the aim is something other than to track an identified portfolio of risks.
Indexation is typically reported as a percentage – premium or policy count in respect of bound business divided by that which is in-scope for the portfolio – where perfect indexation is 100% (see below). Other terms commonly used in relation to indexation include ‘utilisation’ and ‘adoption’. While these may sometimes refer to distinct metrics, they are frequently used interchangeably, highlighting the need for clarity, so all parties understand what is being measured and reported.
It may be the coverholder’s responsibility, if set out in the agreement, to gather all the relevant information and data to calculate indexation in an appropriate manner. The accuracy and completeness of this should be an area of audit or due diligence of the underwriter.
Why is it important for portfolio trackers?
Portfolio trackers should, in theory, balance the good with the bad as they should reflect the in-scope portfolio. If capacity is unfavourably deployed towards historically poor performing risks rather than evenly across the portfolio, then the loss ratio of the portfolio tracker may be impacted, affecting the long-term sustainability of the facility. Conversely, portfolio trackers should not tend to be selective toward the best-performing risks, as they aim to track the entirety of a portfolio that supports the needs of brokers to offer capacity to their clients.
Portfolio trackers succeed through diversification of risk, often by class of business and/or geography. The initial assessment of a portfolio tracker opportunity by carriers involves reviewing the composition of an existing portfolio and future development projections. Any large deviations from the anticipated portfolio mix can impact the success and therefore long-term sustainability of the facility. For example, a facility may have been presented as being 65% short tail, 35% long tail, so if indexation in long tail casualty lines is poor, then the carriers’ appetite may no longer be satisfied by the facility.
Furthermore, large deviations from the anticipated portfolio mix will result in inaccurate actuarial pricing: portfolio trackers typically apply a development pattern based on the projected business composition and derive an expected ultimate loss ratio accordingly. Significant deviation from the anticipated portfolio, i.e. indexation at significantly less than 100%, can lead to an inappropriate ‘loss pick’, reducing a carrier’s ability to accurately reserve.
Monitoring how well indexed a portfolio tracker is relies upon coverholders regularly reporting on indexation metrics, so that any areas of concern around low levels of indexation can be identified early, and a proactive approach can be taken to address the concern.
Methods of measuring indexation
As mentioned above, a standard formula for indexation is set out below: a variety of different metrics can be calculated by replacing the X in the formula (e.g. most likely to be premium or number of risks in the potential portfolio).
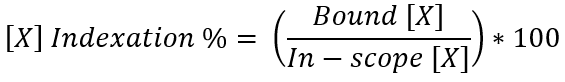
The fraction denominator within this formula (i.e. the bottom number of the fraction) is the ‘in-scope’ portfolio – getting this right is difficult and critical – and the top line is the portfolio that has been bound.
The process of measuring indexation can be broken down into three main elements: scoping methodology; reporting metrics; and reporting of missed opportunities.
Scoping methodology
Successful indexation measurement relies on the accurate and transparent assessment of in-scoping risks. Underwriters and coverholders have varying approaches as to what is considered in-scope for indexation. Illustrative examples of “outcome reasons” and categorisation for in/out of scope are given below.
| In scope (included within the denominator) | Out of scope (excluded from the denominator) |
|---|---|
| Not taken up due to broker choice | 100% single markets |
| Not offered due to late submission | Unapproved leaders/risk codes |
| Not offered due to delayed referral response | Policy periods exceed maximum for facility |
| Not offered due to limited aggregate capacity | Excluded territories/insureds/failed ESG |
| Client declinature – pricing | Suitable alternative option taken up |
| Client declinature – insurer continuity/loyalty | Broker lost the account at renewal |
| Client declinature – outstanding claims | Referral declined |
| Limits in excess of facility maximum $/% line size |
On the above table, where the parameters of the facility have restricted the placement, this should be deemed ‘out-of-scope’ as there is nothing the coverholder can do to place the business in the facility. ‘In scope’ reasons are those over which the coverholder has some degree of control or influence over the placement or otherwise of the business in the facility.
It may be that it is unclear as to whether a given item should be deemed in or out-of-scope for indexation purposes, e.g. reduced lines/missed opportunities due to limited aggregate capacity. The scoping exercise is typically carried out jointly between the Lead Underwriter and coverholder, and the in-scoping criteria shared with the panel participants for transparency. Following this in-scoping exercise, the quality and range of reporting metrics then add quantifiable results that can be monitored.
The in-scoping process is most effective when it occurs both prior to the facility period and during, by class of business. An initial assessment of the in-scope portfolio is necessary for parties to consider its likely performance. Underwriters should conduct an ‘ex-post’ in-scoping at regular intervals once the true subject portfolio is known with certainty. This allows for unknowns, such as new or lost business or any uncertainty or inaccuracies in the in-scoping process, to be corrected prior to the calculation of the indexation. This is necessary to avoid corrupting indexation measures with irrelevant data.
Reporting metrics
Some coverholders measure indexation by combining multiple metrics to aid high-level tracking over time. However, it should be remembered that there is no single measure that can fully convey the indexation of a portfolio. True indexation requires assessment using a variety of different metrics, as the success of one metric does not necessarily result in good indexation throughout. Examples of metrics that can be used to measure indexation include the following:
- % Client Indexation – proportion of in–scope clients that bound at least one policy.
- % Policy Indexation – proportion of total in–scope policies (UMRs) that were bound.
- % Premium Indexation – proportion of in–scope premium that was bound. This should ideally be measured using GWP for the portfolio tracker’s participation.
- % Layer Indexation – proportion of in–scope layers that were bound. This is typically done on a per-programme basis and then averaged across a portfolio.
- % Signings – proportion of offered capacity that was signed (written vs. signed line).
- Average % of Order (a) – the average signed % line relative to the total order of the policy. Note: relevant for portfolio trackers that offer lines based on order size.
- Average Signed % line (b) – the average signed % line. Note: relevant for portfolio trackers that offer lines based on whole only.
- Average Limit utilization – the average $ limit deployed across a programme.
The final three metrics listed above monitor the capacity deployment and can be used to assess any areas where capacity is being unduly restricted by the line size or capacity limits (e.g. where the percentage line is restricting the $ use or vice versa).
Policy and premium indexation measures are the most typical measures in use today. The more granular and regular the reporting, the easier it is to identify trends to proactively manage any actions required to improve indexation.
Reporting of missed opportunities
The final element of indexation that may be reported on is in-scope opportunities that were ultimately not taken up. For example, if a portfolio achieves 98% indexation, reviewing the reasons for the remaining 2% through an ‘NTU’ (not taken up) assessment provides context as to why they were not taken up, so these can be addressed to improve indexation.
Although out-of-scope missed opportunities are not directly relevant to indexation monitoring, tracking metrics will increase transparency and identify areas where expanding the facility’s scope may address gaps, such as risks involving unapproved leaders or risk codes. Underwriters and coverholders could also assess the relative performance of the out-of-scope business.
Conclusion
Reporting indexation with multiple metrics by class of business and in total provides a comprehensive picture. Regular reporting allows underwriters to fully assess the performance of the capacity deployment. Coverholders should have the ability to gather all the necessary information and data to calculate indexation in an appropriate manner.
Appendix A illustrates an example indexation report for a specific month across various metrics. The first two columns demonstrate the difference between the initial in-scope EPI prediction for the month relative to the revised EPI following any adjustments to the in-scoping exercise. At a high level this comparison allows recalibration of the indexation figures against the revised EPI, while still reporting on the initial EPI for the month so that carriers are aware of any movements against original projections.
Appendix B then shows an alternative view where a single indexation metric is selected, with variability shown by month per class of business. This allows for visibility of any trends in indexation over time, highlighting any areas of concern in need of review.
Appendix C goes into greater depth around the challenges associated with calculating indexation.
Appendix A – Indexation reporting for each month independently
An illustrative table showing the individual metrics by class of business, with the ability to select a timescale (e.g. monthly, quarterly, annually, year to date). Regular reporting will add context to the indexation of the portfolio by assessing multiple indexation metrics simultaneously.
| Select reporting period ▽ | |||||||||
| In-scope premium (initial EPI) | Revised In-scope premium | % Client indexation | % Policy indexation | % Premium indexation | % Layer indexation | % Signings | Average % Order/Average signed % line | Average Limit utilisation | |
| International Property | |||||||||
| North American Property | |||||||||
| Construction | |||||||||
| Product Recall | |||||||||
| Power | |||||||||
| Marine Cargo | |||||||||
| Marine Hull | |||||||||
| Marine Liabilities | |||||||||
| Specie | |||||||||
| Energy | |||||||||
| International Casualty | |||||||||
| US Casualty | |||||||||
| Healthcare and Other Casualty | |||||||||
| Professions | |||||||||
| Commercial D&O | |||||||||
| Financial Institutions | |||||||||
| Other Financial Services | |||||||||
| Cyber | |||||||||
| … | |||||||||
In-scope premium (Initial EPI): Based on the initial in-scope analysis, what the estimated premium income (EPI) was
Revised In-scope premium (ultimate EPI): With hindsight, what ultimately ended up being in-scope:
- Following the removal of any risks that were no longer in-scope (e.g. policies that moved to 100% single markets)
- Following the addition of new business that fits the in-scoping criteria
Appendix B – Indexation reporting demonstrating trends by indexation measure
A second illustrative table showing the indexation measurements over time (per month independently), with a drop-down to select the indexation measure you wish to review, e.g. client indexation, policy indexation, premium indexation etc. This report will give visibility over how indexation is tracking with time per class of business.
| Indexation measure ▽ | ||||||||
| January | February | March | April | May | June | July | … | |
| International Property | ||||||||
| North American Property | ||||||||
| Construction | ||||||||
| Product Recall | ||||||||
| Power | ||||||||
| Marine Cargo | ||||||||
| Marine Hull | ||||||||
| Marine Liabilities | ||||||||
| Specie | ||||||||
| Energy | ||||||||
| International Casualty | ||||||||
| US Casualty | ||||||||
| Healthcare and Other Casualty | ||||||||
| Professions | ||||||||
| Commercial D&O | ||||||||
| Financial Institutions | ||||||||
| Other Financial Services | ||||||||
| Cyber | ||||||||
| … | ||||||||
Appendix C – Example process and challenges
Example process flow
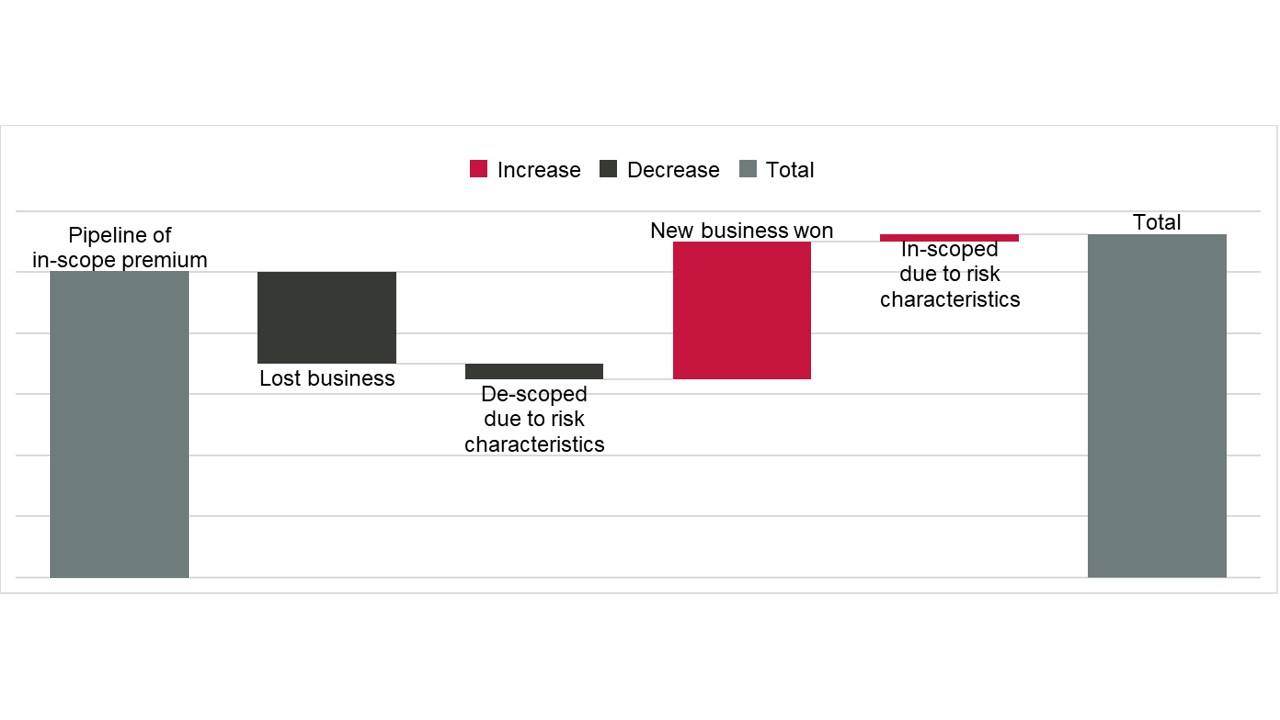
- The process of determining the in-scope portfolio starts with the pipeline of upcoming renewals (and to the extent possible, new business) and assessing their suitability for the tracker against the underwriting parameters.
- All risks are appropriately labelled based on the outcome, so that any risks that did not bind have reasons as to why they were not taken up.
- These NTU reasons are categorised as either in-scope or out-of-scope. Some risks that previously met the in-scope criteria may not have been eligible for renewal due to changes in the underlying factors, e.g. change in leader that was no longer in scope. Additionally, any business lost by the broker needs to be de-scoped from this exercise.
- Retrospectively review any additional risks that were bound that may not have been in the initial in-scope pipeline, including new business won by the broker, or newly in-scope risks that previously did not meet the underwriting parameters.
- A full in-scoping review from pipelining stage to post-bind reconciliation is required to fully assess the in-scope criteria against which indexation needs to be measured. This requires there to be consistent labelling of outcome reasons. Parties need to pay attention that confidentiality and competition concerns are not engaged.
In a facility’s first year, there is often insufficient data to form a perfect in-scoping exercise, making the ex-post monthly review of the in-scoping vital in understanding true indexation as opposed to inaccurate in-scoping. Additional controls/sign-offs may be required during this period to prevent significant deviations from expected early on.
Should 100% indexation be achievable?
There will always be optionality for clients as to whether or not to accept capacity from a portfolio tracker, meaning that indexation will never reach 100%. As a result, many trackers now offer incentives to clients, such as discounts on the lead premiums, encouraging the use of the tracker capacity. The end client cannot be forced to purchase cover from tracker portfolios but can be encouraged and incentivised to do so, subject to any duties that the broker will owe to the insured. The coverholder can also take steps such as communicating the benefits of utilising the tracker to both brokers and clients in areas where indexation is poor. Stating the obvious, giving discounts to lead premiums and additionally payments for participating on the tracker will mean that the portfolio will track at a higher loss ratio than an open market lead on the same business.
Should client declinatures count negatively against indexation?
As discussed above, indexation is a measure of how well the coverholder is deploying the capacity. If a client chooses to decline the portfolio tracker’s capacity, should the coverholder be penalised for this, given it is out of the coverholder’s control? Some suggest that client declinatures should be de-scoped and not be included within the denominator. This would support 100% indexation being achievable to the coverholder based on factors that are within their control.
However, this may devalue the indexation metric. Furthermore, clients may be sceptical about the optionality of portfolio trackers should they see that portfolio trackers are achieving 100% indexation, as clients should always have the final decision as to whether they opt to take it up. However, a proposed workaround for this is having separate indexation measures including and excluding client declinatures, so that declinatures outside the control of the coverholder are not taken into account. Overall indexation may be 85%, but excluding client declinatures, coverholder indexation may be much higher, again adding further context to the final metrics.
Should reduced lines following aggregate limit restrictions count negatively against indexation?
Contractual aggregate exposed limits and modelled limits are often set upfront based on the anticipated portfolio, so that underwriters can manage their exposure and purchase appropriate reinsurance. Coverholders monitor utilisation relative to these limits, and if they are nearing these limits, they may cut back on line sizes or decline risks in some regions. If the coverholder was not proactive in assessing changes in the portfolio throughout the year and addressing any requests to increase limits in advance of any concerns, then any remedial action of reducing line sizes/declining risks may count negatively on indexation.
If, however, a small limit was deliberately set by underwriters due to appetite, then any reduction in capacity as this limit is neared may not count against the coverholder from an indexation perspective (though the line size should have been reduced for that class/region to manage this in a controlled way).
How should premium indexation be calculated?
Ideally, premium indexation should be measured using the GWP for the portfolio trackers’ participation. For large programme limits, the % line sizes will often be restricted by the $ limits, and the in-scope premium for the portfolio tracker will depend on the programme structure. What is deemed the in-scope GWP to the portfolio tracker can therefore change significantly from the pipeline stage until the risk(s) have bound, as policies become in/out of scope and premiums are negotiated. For NTUd risks, the only way to determine this in-scope GWP would be to quote the portfolio tracker lines retrospectively based on the bound policies, which would often be a manual exercise and difficult to regularly review.
Where premium indexation is presented using 100% GWP for the in-scope policies, rather than calculating the portfolio trackers’ participation based on realistic %/$ lines, this does not truly reflect the premium indexation across a portfolio as the outcome would result in very high premium programmes unfairly skewing the premium indexation results even if the tracker line sizes in scope were small.
Acknowledgements
The LMA would like to thank the members of the CUO Committee and the CUOC Enhanced Underwriting Subcommittee for their contribution to this report. Thank you in particular to Colum D’Auria and Elinor Taylor.