The Claims Capability Framework for new entrants sets out the skills and experiences a claims adjuster is expected to develop within their first two years in the London market. By creating this framework, the market aims to demonstrate its commitment to delivering high-quality foundational learning for the claims profession.
What is the framework?
The framework provides a clear pathway for claims capability and aims to raise the bar by delivering consistent foundational learning for the claims profession. It consists of:
Claims capabilities – the baseline level of technical knowledge and skill development for new claims entrants across the London market, to be achieved within two years.
Learning resources – examples of how organisations might support the development of the claims capabilities. These are suggestions, not requirements.
How was it developed?
This framework has been co-created by market participants, ensuring it reflects both current practice and emerging skill requirements. Thirty-seven individuals from 25 market firms contributed to its development – with representation from Heads of Claims, Claims Managers, emerging claims professionals and HR/L&D specialists across LMA and IUA membership and the broking community. Rosie Chopra, Course Director of MSc Insurance & Risk Management at Bayes Business School, also supported the process through facilitation and bringing an academic perspective.
Market adoption
By continuing this collaborative approach, we hope the framework becomes a pathway the market can confidently endorse and work towards when developing new claims professionals. Our goal is to ensure these claims capabilities are applied consistently across the market. Many firms will already cover several of these areas within their existing frameworks. How you choose to deliver and embed the capabilities will be unique to your organisations.
Support and guidance
We have created a progress tracking document designed to help individuals track their own progress and capture reflections.
Each tab represents a section of the framework and breaks down each of the claims capability statements. Individuals can use the document to self assess progress, capture evidence points and supervisor comments, to the extent that is useful.
In September 2025, the LMA claims team issued a follow-up to the 2023 Heads of Claims Talent Survey. When the original survey was conducted, talent had been recognised as a concern across the claims community, but the scale and nature of the challenge were not fully understood. The 2023 results provided critical insight, shaping the work of the NexGen Claims Leadership Group and informing a more coordinated, market-wide response.
That response has included initiatives such as Forage, the development of the first stage of the Claims Capability Framework and the promotion of existing market programmes including London Insurance Life and the LMG Futures Academy. Throughout, our approach has focused on supporting and amplifying existing efforts rather than duplicating them. Collectively, this work has raised awareness of the risks associated with claims talent and helped establish investment in talent as a strategic priority across the market.
Two years on, it was timely to revisit the survey to assess progress, identify shifts in the landscape and explore emerging themes. We received responses from over 50% of Lloyd’s managing agents. While this provides a strong and representative picture of the market, it is worth noting that the findings do not reflect the complete data set, and some perspectives will inevitably remain outside the sample.
The results are clear: talent remains a priority for claims leaders. While many of the challenges identified in 2023 persist, there is now a more nuanced understanding of their underlying drivers, with themes relating to the impact of AI on skills and workforce planning; the potential loss of deep expertise as experienced professionals retire; and continued pressure on the mid-career talent segment.
As always, we welcome your feedback. If these findings prompt questions or insights, please do get in touch.
Janine Powell Claims Director LMA
Key findings
The findings point to encouraging signs at the pipeline’s entry level, reflecting the market’s increased focus on new entrants. However, persistent recruitment challenges and growing concern about the loss of experienced professionals, many of whom are approaching retirement age, are placing increasing pressure on the mid-career segment, and it is here that the most urgent work remains.
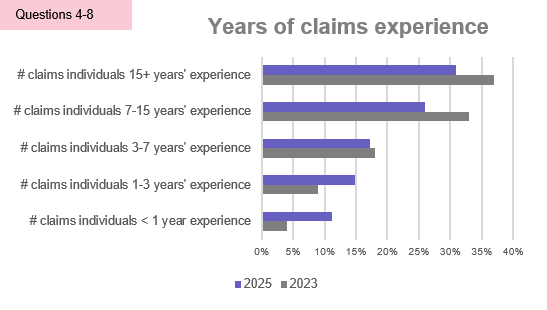
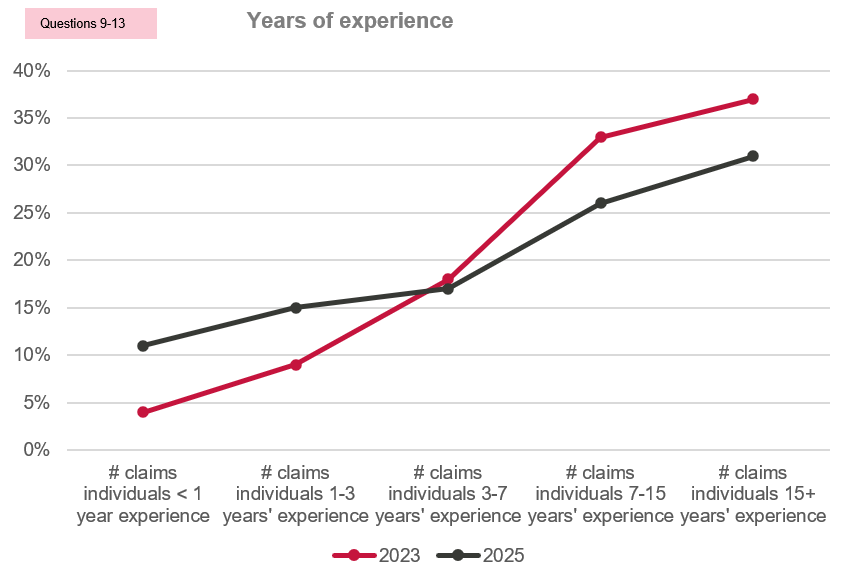
Data indicates an increase in new entrants (individuals with under three years’ experience) alongside a reduction in highly experienced professionals (those with over 15 years’ experience).
There has been increased recruitment of school leavers, graduates and individuals from outside the insurance industry, alongside more internal promotion into senior roles. Notably, “outside of industry” hiring strategies have broadened – from a previous focus on solicitors to a wider emphasis on transferable skills such as data, risk management, digital capability and communication.
Awareness and use of market initiatives – particularly London Insurance Life and Forage – have increased significantly as part of recruitment strategies.
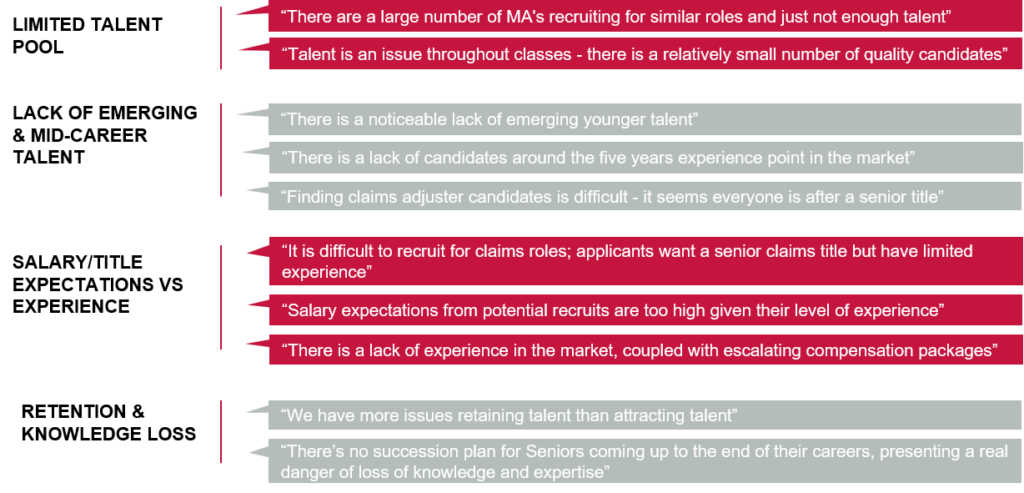
Recruitment challenges continue, including a limited talent pool across classes, rising salary expectations, and ongoing competition for talent. Mid-career professionals appear particularly constrained. Flexible working arrangements (office vs home) have also emerged as a new factor.
The key risks and opportunities over the next 3–5 years remain broadly consistent with 2023. However, there is now greater specificity in how these are articulated, particularly regarding:
the impact of AI on skills and workforce planning
the potential loss of deep expertise due to retirement
continued pressure on the mid-career talent segment.
1. Claims population
Heads of claims were asked to provide details of the seniority, roles and experience levels within their claims teams.
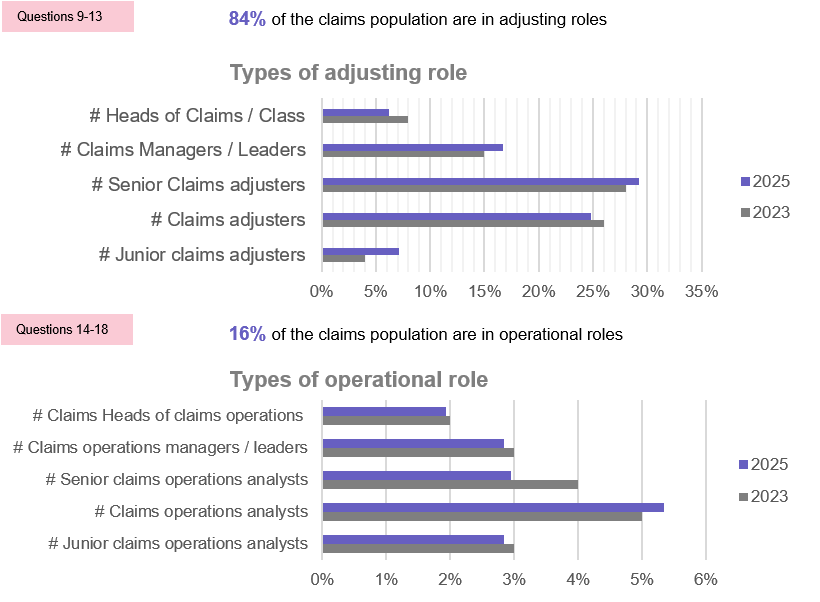
Initial signs suggest a shift in the demographic profile of the claims community; however, population data should be interpreted with caution, as the dataset does not include all managing agents.
The data indicates a notable increase in new entrants, coupled with a downward shift in the proportion of individuals with over seven and fifteen years’ experience, reinforcing anecdotal concerns among heads of claims regarding the loss of experience.
Notes
Population data should be interpreted with caution, as the dataset does not include all managing agents.
All respondents had London-based claims teams. 19% of respondents had claims employees in UK regional offices. 33% had claims employees in international offices (predominately US and APAC).
Some roles have not been accounted for by heads of claims in the data, including: assistant roles, counsel, quality assurance roles and strategic teams.
2. Attracting talent
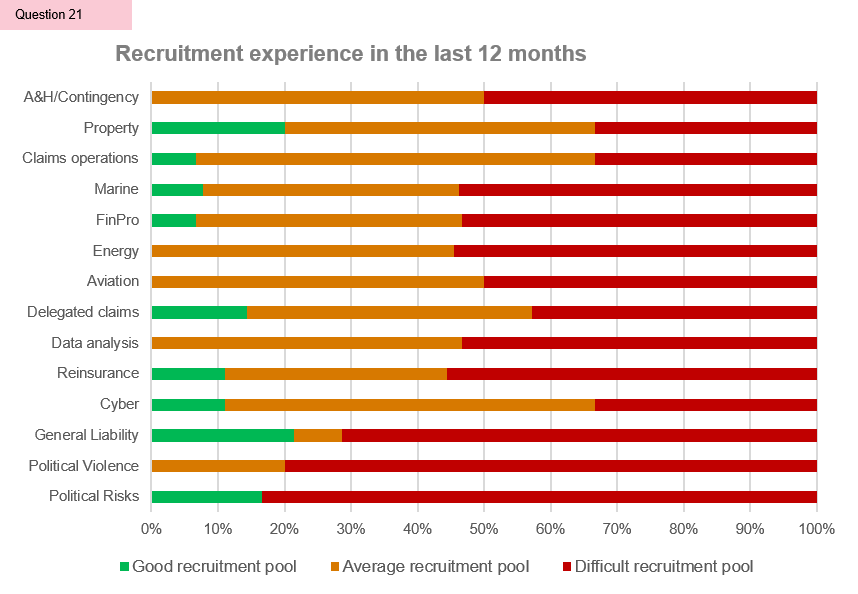
Recruitment conditions across the market have changed little since 2023. There has been limited movement across classes in the overall recruitment experience, and the challenges identified two years ago remain largely intact. This raises a question the market may need to confront directly: are current recruitment models fit for purpose?
Heads of claims are saying:
Salary expectations continue to outpace experience levels with compensation not considered commensurate with the experience candidates bring.
The 5–7 year and 15+ year experience brackets remain the hardest to recruit into, with a continued trend of candidates seeking senior roles without the requisite background.
The available talent pool remains limited across all lines, with niche markets feeling this most acutely.
There remains concerns about “poaching”, with investment in training and development undermined by the difficulty of retaining those who have benefited from it.
A reluctance among candidates to commit to four days a week in the office has emerged as a new and meaningful constraint on recruitment since 2023.
Survey respondents said:
Survey respondents were asked to give details of how they attract and retain talent in claims.
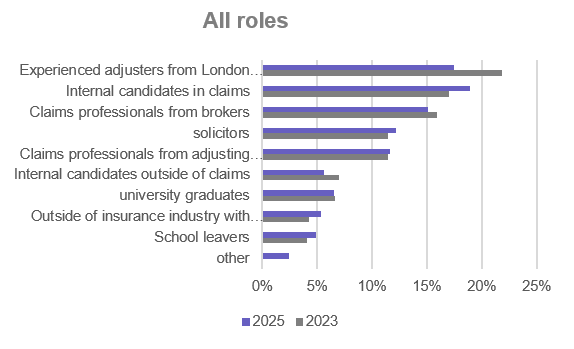
69% of recruitment accesses talent from within the existing market talent pool (down from 74% in 2023).
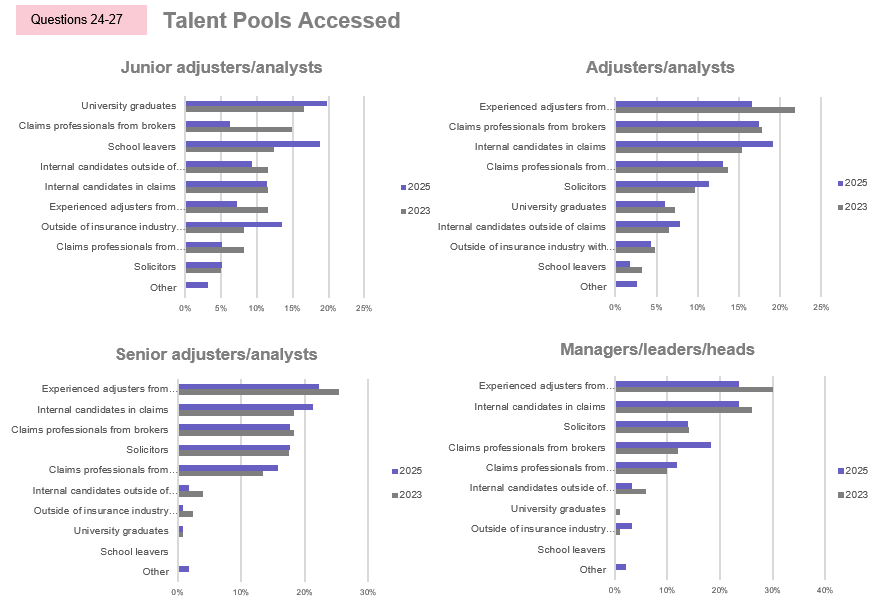
University graduates, school leavers and outside of industry now accounts for 52% of junior roles (an increase from 37% in 2023).
Compared to 2023, the biggest drop in recruitment was of experienced adjusters from London market moving from 22% to 17%.
“Outside of industry” hiring strategies have broadened with a wider emphasis on transferable skills such as data, risk management, digital capability and communication.
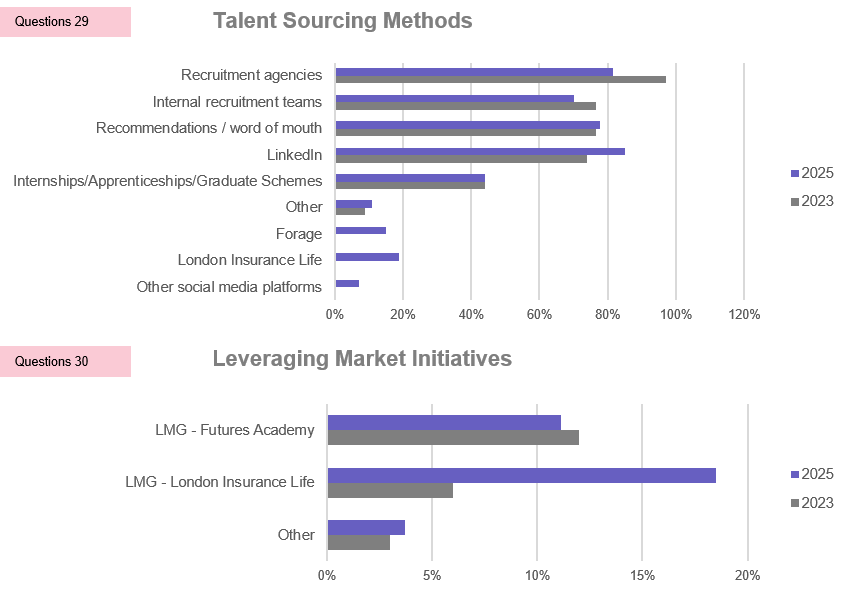
Traditional sourcing methods decreased compared to 2023:the use of recruitment agencies has seen the largest decrease, of 16%, while internal recruitment teams also saw a decrease of 6%.
In addition to an 11% increase in usage of LinkedIn, 33% of respondents have used Forage, London Insurance Life and/or other social media platforms to source talent.
The results indicate increased awareness and use, across the claims community, of the LMG’s London Insurance Life to advertise early careers roles (at no cost to the market).
3. Looking ahead
The risks and opportunities identified by heads of claims over the next 3–5 years remain broadly consistent with those of 2023, but with a sharper and more specific articulation of where the pressure is greatest. Three themes have come into clearer focus: the impact of AI on skills and workforce planning; the potential loss of deep expertise as experienced professionals retire; and continued pressure on the mid-career talent segment.
When asked whether their view of future risks and opportunities had changed, heads of claims pointed to two overriding factors: the pace of technological change and increased automation, and a perceived reduction in knowledge and expertise within the market. Together, these are reshaping expectations of what good looks like in a claims professional.
The skills most frequently cited as critical for the future reflect this shift:
data analytics
technical expertise
customer communication
relationship management
portfolio management
adaptability and strategic thinking.
The presence of both technical and relational skills on this list is notable, suggesting that while technology will change how claims work is done, the human dimensions of the role remain highly valued. The challenge for the market is developing professionals who can credibly deliver both.
4. Risks and opportunities
The risks and opportunities identified by heads of claims have sharpened since 2023, with AI, building new skills and capability and the mid-career gap emerging as the defining features of the next 3–5 years.
Risks identified
Opportunities identified
The advancing retirement of experienced claims professionals presents a significant risk to deep market expertise, with limited succession pipelines to absorb the loss of institutional knowledge.
AI and automation, if embraced effectively, free claims professionals from more routine tasks – creating space for higher-value problem solving, judgment and expertise.
The mid-career gap remains a structural concern, with the number and types of roles increasingly misaligned with the available talent pool.
The digitalisation of claims creates genuine demand for new technical profiles (data analysts, technology specialists and digitally fluent adjusters) opening the door to talent pipelines that did not previously exist.
AI and digitalisation risk makes elements of claims adjusting less stimulating, potentially deterring talent at the point of entry or prompting early exits.
New and emerging insurable risks offer the opportunity to diversify into new areas, attracting candidates motivated by complexity and innovation.
The shift in required skillsets towards data, analytics and technology means existing talent may find their capabilities less relevant without sustained investment in development.
Claims has a growing story to tell as a career destination; one that is central to protecting customers and delivering on the promise of insurance, with increasing commercial visibility in winning and retaining business.
Underinvestment in training, compounded by competitive recruitment environment, creates a disincentive to develop talent and risks a race to the bottom across the market.
A sharper market focus on data creates opportunity to build new capability and attract professionals from adjacent fields.
The LMA International Bodily Injury Index (BII) provides a comprehensive view of bodily injury compensation outcomes across a broad international sample. By applying a consistent set of injury scenarios across multiple jurisdictions, it enables like-for-like comparison of indicative award values and helps track how those values change over time.
The Index is designed to be used by underwriters, claims professionals and risk specialists in managing agents to help in understanding bodily injury exposure across jurisdictions. It does not predict individual claim outcomes; actual claims depend on the specific facts of the case, liability, evidence, policy terms and local procedural requirements.
This overview focuses on interpretation and context. Detailed figures, jurisdiction-level data and scenario-specific analysis are available to subscribing managing agents.
The value of the International Bodily Injury Index lies in its ability to cut through anecdote and provide a consistent, evidence-based reference point across jurisdictions.
– David Fitzpatrick, Chair of the International Liability Business Panel
Purpose and value of the index
The International Bodily Injury Index provides a structured, transparent reference point for understanding how bodily injury awards vary internationally and how the sums awarded evolve over time. By applying consistent scenarios across a wide jurisdictional sample, the Index supports more informed discussion of claims cost trends and their drivers.
The 2024 to 2025 comparison establishes a baseline against which future movements can be assessed, allowing meaningful differentiation between gradual change and genuine structural shifts as the dataset develops over time.
Scope of the index
The BII covers:
96 jurisdictions, excluding the US, covering a broad international sample across multiple regions.
56 local currencies.
Eight standardised bodily injury scenarios – from minor injuries to catastrophic injuries and fatal outcomes.
The same claimant profiles and injury definitions are used in every jurisdiction. This standardisation allows differences in indicative award values to be compared across jurisdictions and over time, where data is available.
All figures are shown in local currency to reflect how awards are assessed and settled in practice within each jurisdiction.
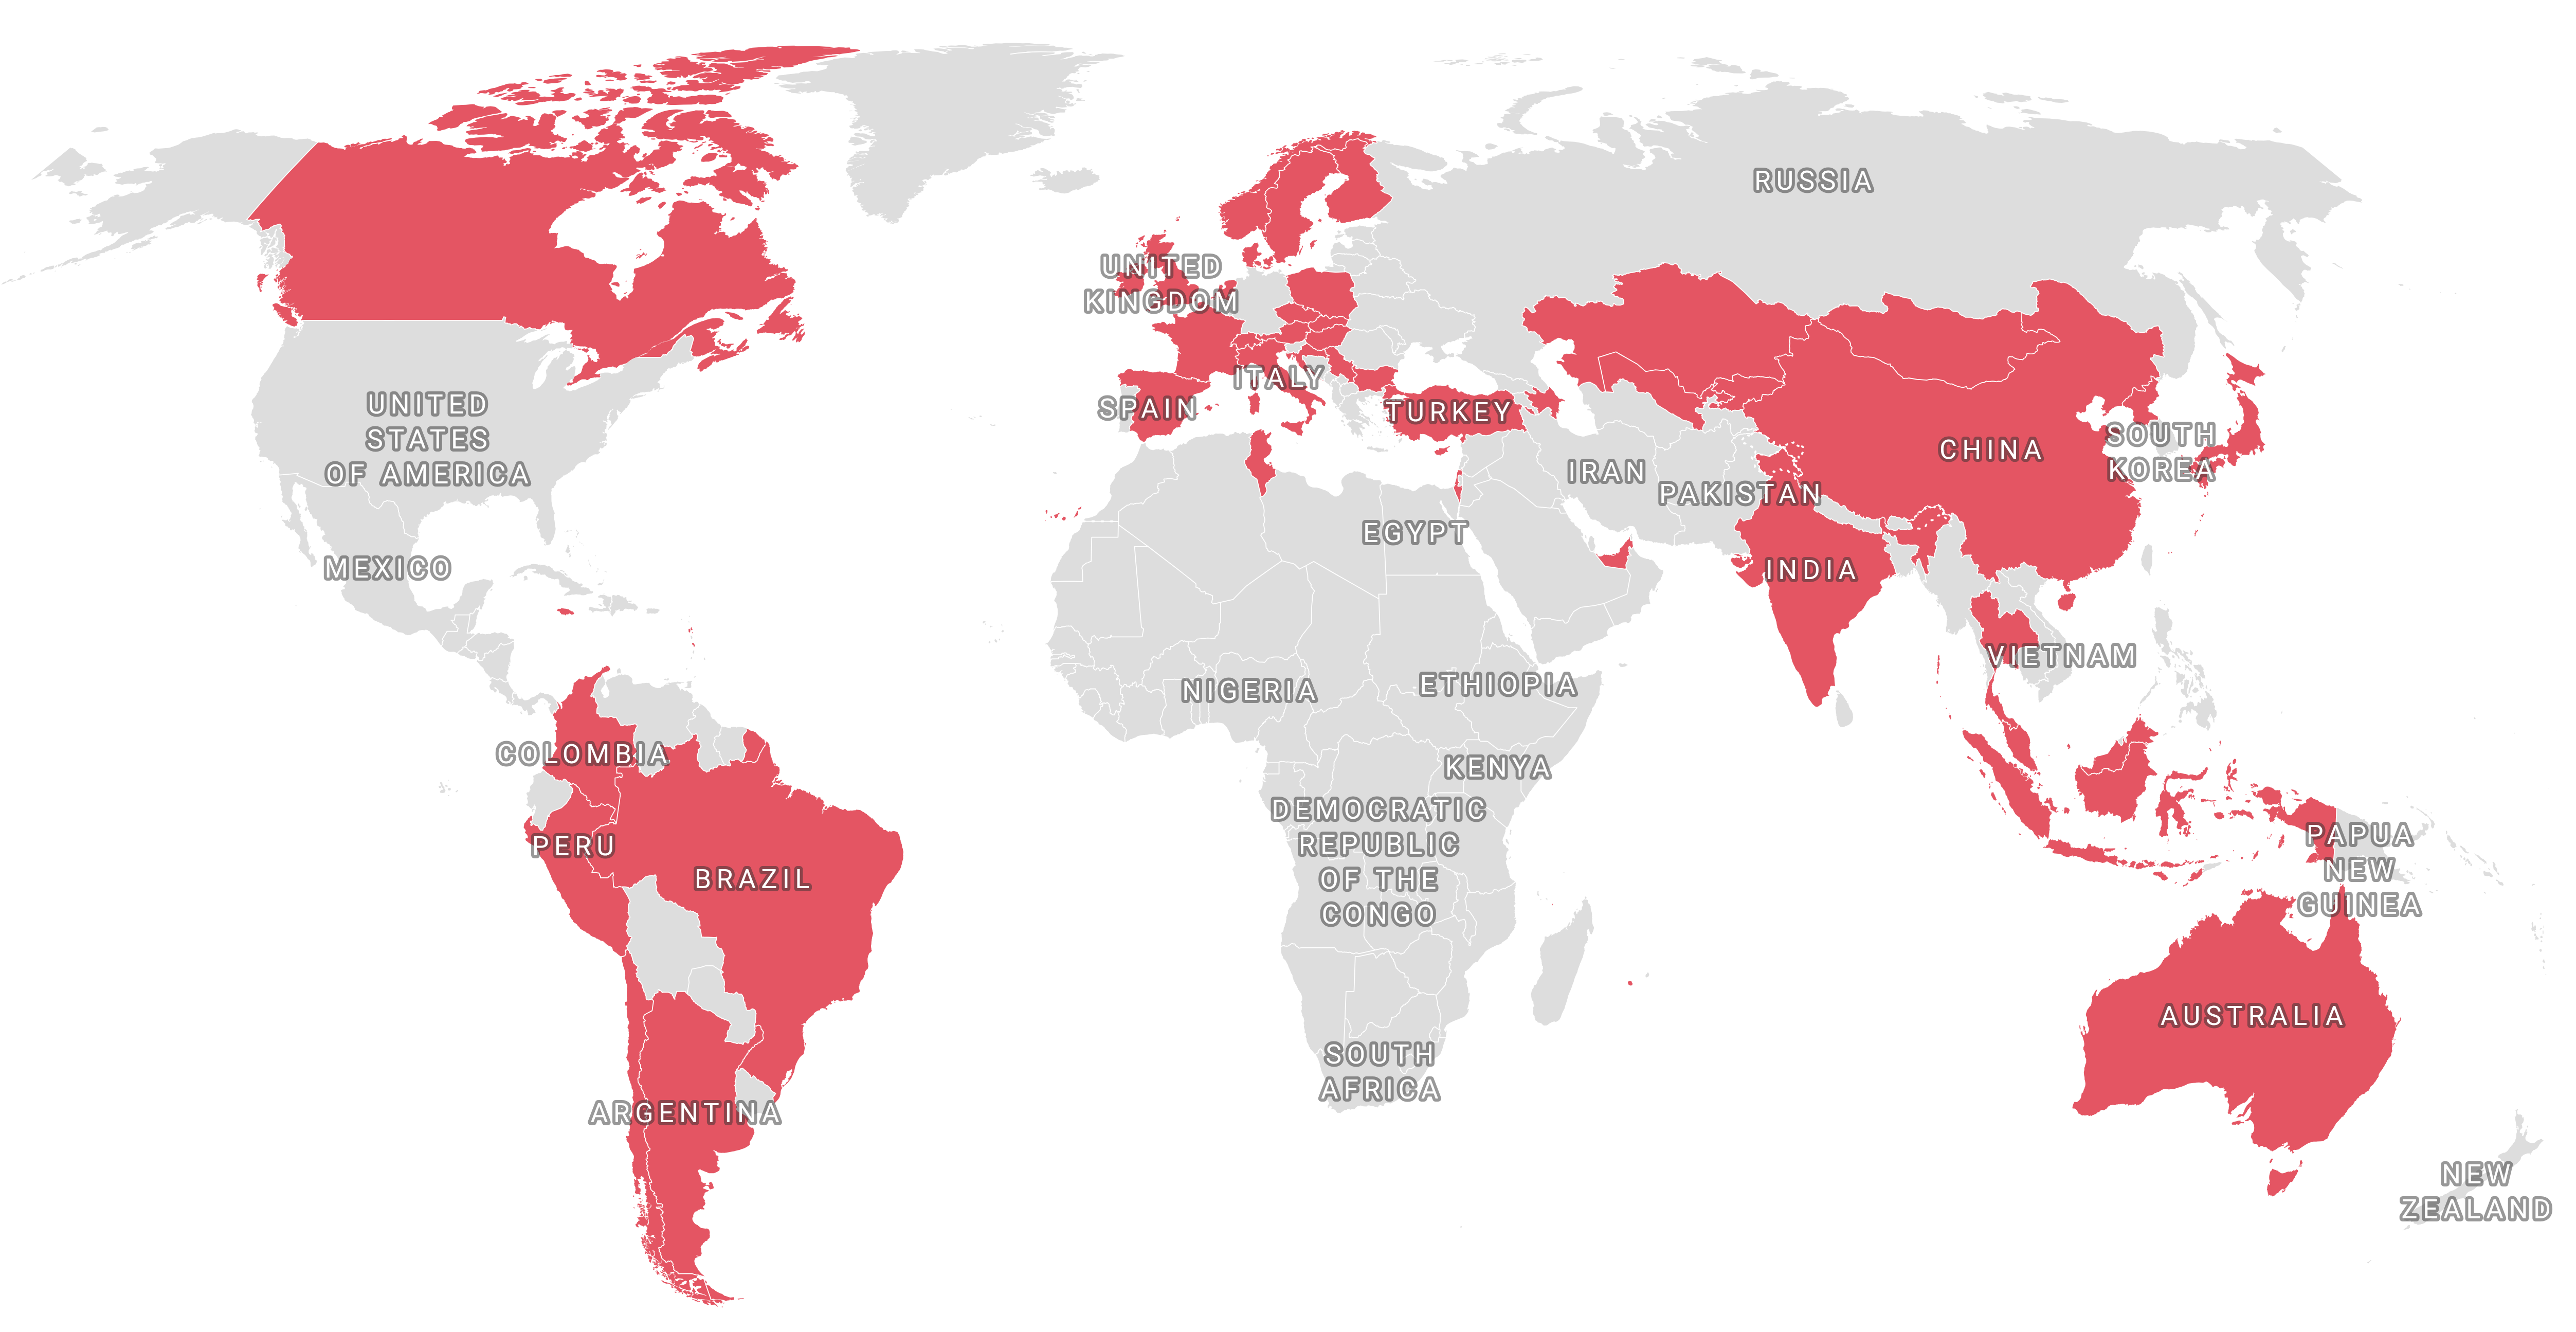
Figure 1. International coverage of jurisdictions included in the LMA International Bodily Injury Index where year-on-year data is available (i.e. jurisdictions where values in both 2024 and 2025 are available).
Figure 1 note: Jurisdictions not shown may still be included in the Index but do not have complete data for both years yet.
Data availability and interpretation
The Index prioritises transparency and comparability. As a result, not every jurisdiction has complete data across every scenario and year.
Year-on-year analysis is based only on like-for-like comparisons, meaning jurisdictions where the same scenario has values in both 2024 and 2025.
What the data shows from 2024 to 2025
Data note
This analysis reflects the dataset as at 15 January 2026 and is based on jurisdictions with values available in both 2024 and 2025 at that time. The Index is updated periodically as additional jurisdictional data becomes available. Subsequent updates may expand the like-for-like sample and refine the distribution of movements.
Coverage for year-on-year analysis
Across the eight scenarios, between 59 to 60 jurisdictions currently have values available in both 2024 and 2025, depending on data availability for the specific scenario. These jurisdictions form the basis for year-on-year movement analysis.
Typical year-on-year movement
Across jurisdictions where values are available in both 2024 and 2025 (the like-for-like set used for year-on-year comparison), the median year-on-year change is modest:
Minor or superficial injuries: increase of 1%.
Broken limb injuries: increase of 1%.
Serious and catastrophic injuries (including amputation, loss of sight, psychiatric injury, brain injury and paralysis): increases typically between 2% and 3%.
Fatal outcome scenario (full awareness of death): increase of 3%.
The distribution shows that most jurisdictions experienced incremental, rather than dramatic movement, between 2024 and 2025. However, a small number of jurisdictions show more pronounced year-on-year movements. Ten to fifteen jurisdictions fall into the “large increase” band (more than 10% year-on-year), depending on the scenario.
For example, in the minor or superficial injuries scenario, jurisdictions such as Uzbekistan and Japan show large year-on-year increases, while in the paralysis scenario, large movements are seen in jurisdictions such as the UAE and Jamaica. These larger shifts are typically linked to discreet local developments, such as legislative change, court practice shifts or updated valuation reference points.
Distribution and variability
Although median movements are low, the distribution of outcomes is wider for some scenarios. Interquartile ranges vary materially, particularly for minor injuries and paralysis. This reflects differing local dynamics rather than a uniform global trend.
Across scenarios, a significant proportion of jurisdictions show no year-on-year change at all. Depending on the scenario, between 15 and 25 jurisdictions remain unchanged within the like-for-like sample.
Direction of change
Increases are more common than decreases, but decreases do occur:
In minor injury scenarios, 53% of jurisdictions showed increases, 5% decreased and 42% were unchanged.
In fatal outcomes scenarios, 64% increased, 5% decreased and 31% were unchanged.
This demonstrates that bodily injury awards are not moving uniformly in a single direction across all jurisdictions.
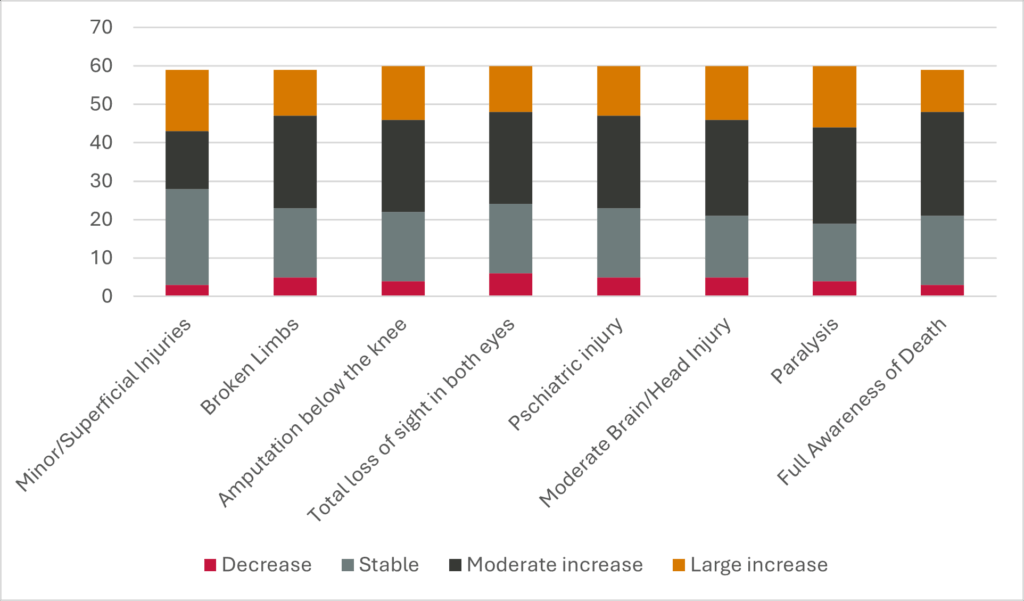
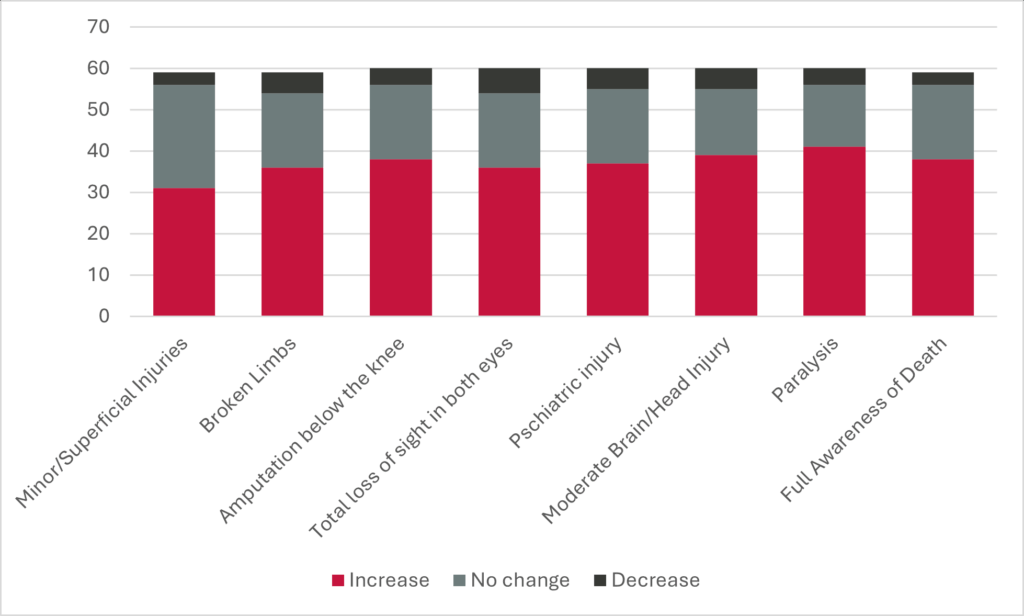
The charts below are derived from the International Bodily Injury Index. They illustrate high-level patterns and do not display detailed figures or jurisdiction-level values. The two charts present complementary views of year-on-year movement. Figure 1 shows the scale of change by grouping jurisdictions into movement bands, while Figure 2 shows the overall direction of movement across jurisdictions.
Figure 2. Distribution of year-on-year movements by injury scenario (like-for-like jurisdictions only)
Figure 2 note: For each scenario, jurisdictions are grouped into bands based on the year-on-year percentage change between 2024 and 2025 in the indexed award value, for like-for-like jurisdictions only. Decrease means values decreased year-on-year. Stable means 0% change. Moderate increase means an increase greater than 0% and up to 10%. Large increase means an increase greater than 10%.
Figure 3.Direction of year-on-year change by injury scenario (like-for-like jurisdictions only)
Figure 3 note: For each scenario, jurisdictions are categorised based on the year-on-year movement between 2024 and 2025 in the indexed award value, for like-for-like jurisdictions only. Increase means values increased year-on-year. No change means values were unchanged. Decrease means values decreased year-on-year.
What the data shows is not a single international story, but a pattern of stability for many jurisdictions alongside targeted areas of change driven by local legal and economic factors.
– Chris Mather, Senior Executive, Technical Underwriting at the LMA and Secretary of the International Liability Business Panel
Step changes and outliers
As set out above while the median year-on-year changes are modest and most jurisdictions fall within the stable or moderate movement bands, a smaller group falls into the “large increase” band, defined as movements of more than 10% year-on-year.
Examples observed in the data include:
In a small number of jurisdictions, year-on-year movements fall into the “large increase” band (more than 10% year-on-year), representing a minority of the like-for-like set. These more pronounced shifts tend to be concentrated in higher-severity scenarios and are more consistent with discrete local developments than with gradual inflation.
Larger step changes are more commonly seen in higher-severity scenarios (for example, paralysis and amputation) where local valuation frameworks can shift materially.
Decreases are less common than increases and are limited to a handful of jurisdictions per scenario, with some of the more notable decreases appearing in minor or superficial injury scenarios.
These outliers can skew the overall average when year-on-year percentage changes are summarised across jurisdictions. The analysis compares two figures per jurisdiction (2024 and 2025) and calculates a year-on-year percentage change for each jurisdiction in the like-for-like set. These jurisdiction-level percentage changes are then summarised across that set. To avoid distortion from outliers, this overview presents the median and the distribution of movements rather than relying on a single average figure. Larger shifts may also point to discrete local developments, such as legislative change, shifts in court practice, updated damages guidelines and valuation reference points, influencing outcomes in particular jurisdictions.
Why this is significant
Stability is itself a finding
The data shows that international bodily injury awards are not experiencing uniform escalation year-on-year. Across scenarios, between 15 and 25 jurisdictions show no year-on-year change within the like-for-like samples. For example, 42% of jurisdictions remain unchanged in the minor injury scenarios and 31% unchanged in the fatal outcome scenario. In an environment where social inflation is often discussed in broad terms, the Index demonstrates that the reality is more uneven and jurisdiction specific.
Inflationary pressure is local, not universal
Where increases occur, they are unevenly distributed. The concentration of changes within specific jurisdictions suggests that local legal frameworks, court practice, economic conditions and claims environments are the primary drivers of movement rather than a single international trend.
Step changes indicate structural shifts
Large year-on-year movements in a small number of jurisdictions are more consistent with structural changes than with gradual inflation. For example, in the paralysis scenario, a small number of jurisdictions show year-on-year increases of more than 100%, including the UAE, Uzbekistan and Jamaica. Isolated decreases also occur, particularly in the minor or superficial injury scenario, for example, China and Queensland, Australia.
Direction of travel matters
The presence of decreases and unchanged values alongside increases demonstrates that bodily injury awards are not a one-way ratchet. They can stabilise or fall as well as rise, depending on local conditions.
Limitations and context
The scale of the Index is a strength, but it requires careful interpretation:
Blank fields reflect unknown data, not a 0 value.
Figures are indicative benchmark estimates, not claim predictions, developed through specialist legal input and jurisdictional insight.
Local context remains essential and is captured through jurisdiction-specific notes where available.
The Index is not a pricing or reserving tool and should not be used as a substitute for claim-specific analysis.
The Index is not intended to set market benchmarks, tariffs or pricing levels, nor to replace jurisdiction-specific legal advice.
Key definitions
Bodily injury scenario
A standardised, injury outcome used consistently across all jurisdictions. Each scenario is based on the same claimant profile and injury description to support comparability.
Like-for-like comparison
A comparison between years that includes only jurisdictions where a value is available for the same scenario in both 2024 and 2025. Jurisdictions without data in one of the years are excluded from year-on-year analysis for that scenario.
Year-on-year (YoY) change
The percentage change between the 2024 and 2025 indicative values for the same scenario and jurisdiction. Year-on-year analysis is calculated only on a like-for-like basis.
Local currency
Indicative values are shown in the currency used within each jurisdiction. Figures are not converted into a single reference currency to avoid masking local economic and legal dynamics.
Blank data field
A blank field indicates that the relevant value is unknown or unavailable for that jurisdiction and year. It does not mean that the value is zero or that no award is payable.
Indicative value
A benchmark figure reflecting informed market understanding for a defined scenario. Indicative values are not claim outcomes and should not be interpreted as pricing, tariffs or guaranteed awards.
Jurisdiction
A country or legally distinct legal system included within the Index. In some cases, (for example, Australia and Canada, we have dealt with different states within the country as their rules and awards can differ materially.)
Methodology (how year-on-year movement is calculated)
Year-on-year movement is calculated using the LMA International Bodily Injury Index’s standardised scenarios, comparing 2024 and 2025 values on a like-like basis. For each scenario, jurisdictions are included only where values are available in both years.
The year-on-year percentage change is calculated as:
Subscribe to access the full dataset
Subscribing managing agents receive full access to the Index, including:
Scenario-level data and jurisdiction-specific insights.
Like-for-like year-on-year comparisons and distribution metrics.
Tools to support deeper assessment of bodily injury exposure and emerging trends.
To request access, please contact Chris Mather, Senior Executive, Technical Underwriting at the Lloyd’s Market Association.
In 2025, we rang the bell on a critical challenge facing the London market: the female underwriting leadership pipeline was going backwards. This year, we move the conversation forward.
The 2026 Underwriting Talent Summit will focus on progression. If we are building a pipeline of talented female underwriters, how do we ensure they reach the most senior leadership roles? What barriers remain? What do future female leaders need from their employers? And what can senior underwriting leaders do differently to create lasting change?
Bringing together CEOs, CUOs and senior underwriters from across the market, this summit will explore the practical actions, leadership behaviours and organisational cultures that enable talent to thrive and progress. Our panellists and speakers will reflect on the reality of building a career in the London market: the achievements, the challenges and how they created their own pathway to leadership.
Agenda: 12 November 2026
09.00
Welcome and registration
09.30
Opening remarks: reflections, progress and the path ahead Sheila Cameron, CEO, LMA
09.45
What matters most? Perspectives from underwriting leaders of the future Panel discussion
10.30
Keynote: AI: the technology that might finally change who gets to the top Tracey-Lee Kus, Co-CEO EMEA, Aon Rachel Turk, Chief of Performance & Strategy, Lloyd’s
11.15
Networking and coffee breakout
12.00
How they really got there: busting the myths of senior leadership Panel discussion
12.45
Closing remarks Sheila Cameron, CEO, LMA
13.00
Close
Speakers
Sheila Cameron
CEO LMA
Tracey-Lee Kus
Co-CEO EMEA Aon
Rachel Turk
Chief of Performance & Strategy Lloyd’s
Further speakers will be announced over the coming weeks.
This paper examines the use of indexation in the review of portfolio trackers and documents methods to measure it. Currently, there is no universally accepted market standard for measuring indexation. As heightened attention has been placed on the performance of portfolio trackers, it is becoming increasingly important to accurately report and be able to compare indexation across facilities so that targeted action can be focused on areas that require it most. It can also form part of contractual arrangements between a portfolio tracking coverholder and underwriters, enhancing the need for calculations to be accurate and transparent. The following discussion suggests a framework for measuring indexation that could be adopted by underwriters and coverholders if thought appropriate.
What is indexation?
Portfolio trackers are supposed to ‘track’ or ‘index’ an entire portfolio of risks, sometimes across many classes of business. Indexation is a measure used to track how well capacity is being deployed across a portfolio. Indexation can also be used to detect anti-selection, i.e. where capacity is more likely to be deployed behind hard-to-place/lower performing risks as opposed to being deployed across all in scope risks. It is not relevant for coverholders operating other follow facilities in which the aim is something other than to track an identified portfolio of risks.
Indexation is typically reported as a percentage – premium or policy count in respect of bound business divided by that which is in-scope for the portfolio – where perfect indexation is 100% (see below). Other terms commonly used in relation to indexation include ‘utilisation’ and ‘adoption’. While these may sometimes refer to distinct metrics, they are frequently used interchangeably, highlighting the need for clarity, so all parties understand what is being measured and reported.
It may be the coverholder’s responsibility, if set out in the agreement, to gather all the relevant information and data to calculate indexation in an appropriate manner. The accuracy and completeness of this should be an area of audit or due diligence of the underwriter.
Why is it important for portfolio trackers?
Portfolio trackers should, in theory, balance the good with the bad as they should reflect the in-scope portfolio. If capacity is unfavourably deployed towards historically poor performing risks rather than evenly across the portfolio, then the loss ratio of the portfolio tracker may be impacted, affecting the long-term sustainability of the facility. Conversely, portfolio trackers should not tend to be selective toward the best-performing risks, as they aim to track the entirety of a portfolio that supports the needs of brokers to offer capacity to their clients.
Portfolio trackers succeed through diversification of risk, often by class of business and/or geography. The initial assessment of a portfolio tracker opportunity by carriers involves reviewing the composition of an existing portfolio and future development projections. Any large deviations from the anticipated portfolio mix can impact the success and therefore long-term sustainability of the facility. For example, a facility may have been presented as being 65% short tail, 35% long tail, so if indexation in long tail casualty lines is poor, then the carriers’ appetite may no longer be satisfied by the facility.
Furthermore, large deviations from the anticipated portfolio mix will result in inaccurate actuarial pricing: portfolio trackers typically apply a development pattern based on the projected business composition and derive an expected ultimate loss ratio accordingly. Significant deviation from the anticipated portfolio, i.e. indexation at significantly less than 100%, can lead to an inappropriate ‘loss pick’, reducing a carrier’s ability to accurately reserve.
Monitoring how well indexed a portfolio tracker is relies upon coverholders regularly reporting on indexation metrics, so that any areas of concern around low levels of indexation can be identified early, and a proactive approach can be taken to address the concern.
Methods of measuring indexation
As mentioned above, a standard formula for indexation is set out below: a variety of different metrics can be calculated by replacing the X in the formula (e.g. most likely to be premium or number of risks in the potential portfolio).
The fraction denominator within this formula (i.e. the bottom number of the fraction) is the ‘in-scope’ portfolio – getting this right is difficult and critical – and the top line is the portfolio that has been bound.
The process of measuring indexation can be broken down into three main elements: scoping methodology; reporting metrics; and reporting of missed opportunities.
Scoping methodology
Successful indexation measurement relies on the accurate and transparent assessment of in-scoping risks. Underwriters and coverholders have varying approaches as to what is considered in-scope for indexation. Illustrative examples of “outcome reasons” and categorisation for in/out of scope are given below.
In scope (included within the denominator)
Out of scope (excluded from the denominator)
Not taken up due to broker choice
100% single markets
Not offered due to late submission
Unapproved leaders/risk codes
Not offered due to delayed referral response
Policy periods exceed maximum for facility
Not offered due to limited aggregate capacity
Excluded territories/insureds/failed ESG
Client declinature – pricing
Suitable alternative option taken up
Client declinature – insurer continuity/loyalty
Broker lost the account at renewal
Client declinature – outstanding claims
Referral declined
Limits in excess of facility maximum $/% line size
On the above table, where the parameters of the facility have restricted the placement, this should be deemed ‘out-of-scope’ as there is nothing the coverholder can do to place the business in the facility. ‘In scope’ reasons are those over which the coverholder has some degree of control or influence over the placement or otherwise of the business in the facility.
It may be that it is unclear as to whether a given item should be deemed in or out-of-scope for indexation purposes, e.g. reduced lines/missed opportunities due to limited aggregate capacity. The scoping exercise is typically carried out jointly between the Lead Underwriter and coverholder, and the in-scoping criteria shared with the panel participants for transparency. Following this in-scoping exercise, the quality and range of reporting metrics then add quantifiable results that can be monitored.
The in-scoping process is most effective when it occurs both prior to the facility period and during, by class of business. An initial assessment of the in-scope portfolio is necessary for parties to consider its likely performance. Underwriters should conduct an ‘ex-post’ in-scoping at regular intervals once the true subject portfolio is known with certainty. This allows for unknowns, such as new or lost business or any uncertainty or inaccuracies in the in-scoping process, to be corrected prior to the calculation of the indexation. This is necessary to avoid corrupting indexation measures with irrelevant data.
Reporting metrics
Some coverholders measure indexation by combining multiple metrics to aid high-level tracking over time. However, it should be remembered that there is no single measure that can fully convey the indexation of a portfolio. True indexation requires assessment using a variety of different metrics, as the success of one metric does not necessarily result in good indexation throughout. Examples of metrics that can be used to measure indexation include the following:
% Client Indexation – proportion of in–scope clients that bound at least one policy.
% Policy Indexation – proportion of total in–scope policies (UMRs) that were bound.
% Premium Indexation – proportion of in–scope premium that was bound. This should ideally be measured using GWP for the portfolio tracker’s participation.
% Layer Indexation – proportion of in–scope layers that were bound. This is typically done on a per-programme basis and then averaged across a portfolio.
% Signings – proportion of offered capacity that was signed (written vs. signed line).
Average % of Order (a) – the average signed % line relative to the total order of the policy. Note: relevant for portfolio trackers that offer lines based on order size.
Average Signed % line (b) – the average signed % line. Note: relevant for portfolio trackers that offer lines based on whole only.
Average Limit utilization – the average $ limit deployed across a programme.
The final three metrics listed above monitor the capacity deployment and can be used to assess any areas where capacity is being unduly restricted by the line size or capacity limits (e.g. where the percentage line is restricting the $ use or vice versa).
Policy and premium indexation measures are the most typical measures in use today. The more granular and regular the reporting, the easier it is to identify trends to proactively manage any actions required to improve indexation.
Reporting of missed opportunities
The final element of indexation that may be reported on is in-scope opportunities that were ultimately not taken up. For example, if a portfolio achieves 98% indexation, reviewing the reasons for the remaining 2% through an ‘NTU’ (not taken up) assessment provides context as to why they were not taken up, so these can be addressed to improve indexation.
Although out-of-scope missed opportunities are not directly relevant to indexation monitoring, tracking metrics will increase transparency and identify areas where expanding the facility’s scope may address gaps, such as risks involving unapproved leaders or risk codes. Underwriters and coverholders could also assess the relative performance of the out-of-scope business.
Conclusion
Reporting indexation with multiple metrics by class of business and in total provides a comprehensive picture. Regular reporting allows underwriters to fully assess the performance of the capacity deployment. Coverholders should have the ability to gather all the necessary information and data to calculate indexation in an appropriate manner.
Appendix A illustrates an example indexation report for a specific month across various metrics. The first two columns demonstrate the difference between the initial in-scope EPI prediction for the month relative to the revised EPI following any adjustments to the in-scoping exercise. At a high level this comparison allows recalibration of the indexation figures against the revised EPI, while still reporting on the initial EPI for the month so that carriers are aware of any movements against original projections.
Appendix B then shows an alternative view where a single indexation metric is selected, with variability shown by month per class of business. This allows for visibility of any trends in indexation over time, highlighting any areas of concern in need of review.
Appendix C goes into greater depth around the challenges associated with calculating indexation.
Appendix A – Indexation reporting for each month independently
An illustrative table showing the individual metrics by class of business, with the ability to select a timescale (e.g. monthly, quarterly, annually, year to date). Regular reporting will add context to the indexation of the portfolio by assessing multiple indexation metrics simultaneously.
Select reporting period ▽
In-scope premium (initial EPI)
Revised In-scope premium
% Client indexation
% Policy indexation
% Premium indexation
% Layer indexation
% Signings
Average % Order/Average signed % line
Average Limit utilisation
International Property
North American Property
Construction
Product Recall
Power
Marine Cargo
Marine Hull
Marine Liabilities
Specie
Energy
International Casualty
US Casualty
Healthcare and Other Casualty
Professions
Commercial D&O
Financial Institutions
Other Financial Services
Cyber
…
In-scope premium (Initial EPI): Based on the initial in-scope analysis, what the estimated premium income (EPI) was
Revised In-scope premium (ultimate EPI): With hindsight, what ultimately ended up being in-scope:
Following the removal of any risks that were no longer in-scope (e.g. policies that moved to 100% single markets)
Following the addition of new business that fits the in-scoping criteria
Appendix B – Indexation reporting demonstrating trends by indexation measure
A second illustrative table showing the indexation measurements over time (per month independently), with a drop-down to select the indexation measure you wish to review, e.g. client indexation, policy indexation, premium indexation etc. This report will give visibility over how indexation is tracking with time per class of business.
Indexation measure ▽
January
February
March
April
May
June
July
…
International Property
North American Property
Construction
Product Recall
Power
Marine Cargo
Marine Hull
Marine Liabilities
Specie
Energy
International Casualty
US Casualty
Healthcare and Other Casualty
Professions
Commercial D&O
Financial Institutions
Other Financial Services
Cyber
…
Appendix C – Example process and challenges
Example process flow
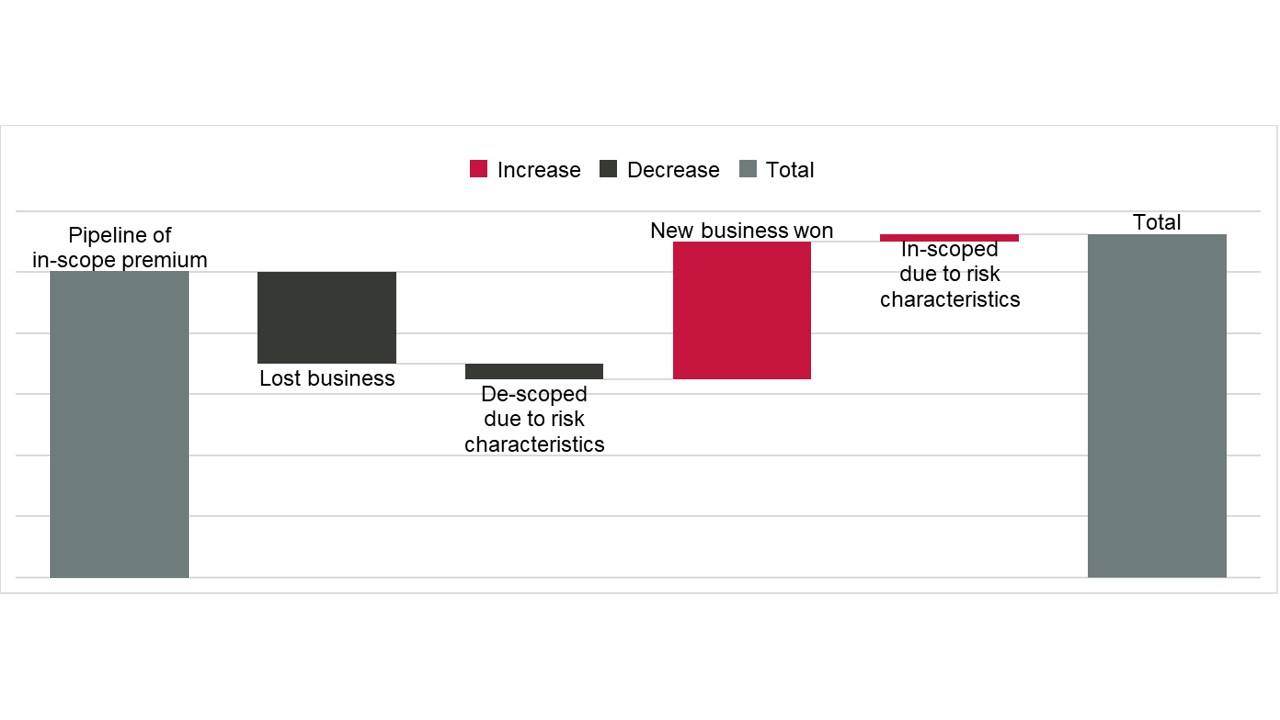
The process of determining the in-scope portfolio starts with the pipeline of upcoming renewals (and to the extent possible, new business) and assessing their suitability for the tracker against the underwriting parameters.
All risks are appropriately labelled based on the outcome, so that any risks that did not bind have reasons as to why they were not taken up.
These NTU reasons are categorised as either in-scope or out-of-scope. Some risks that previously met the in-scope criteria may not have been eligible for renewal due to changes in the underlying factors, e.g. change in leader that was no longer in scope. Additionally, any business lost by the broker needs to be de-scoped from this exercise.
Retrospectively review any additional risks that were bound that may not have been in the initial in-scope pipeline, including new business won by the broker, or newly in-scope risks that previously did not meet the underwriting parameters.
A full in-scoping review from pipelining stage to post-bind reconciliation is required to fully assess the in-scope criteria against which indexation needs to be measured. This requires there to be consistent labelling of outcome reasons. Parties need to pay attention that confidentiality and competition concerns are not engaged.
In a facility’s first year, there is often insufficient data to form a perfect in-scoping exercise, making the ex-post monthly review of the in-scoping vital in understanding true indexation as opposed to inaccurate in-scoping. Additional controls/sign-offs may be required during this period to prevent significant deviations from expected early on.
Should 100% indexation be achievable?
There will always be optionality for clients as to whether or not to accept capacity from a portfolio tracker, meaning that indexation will never reach 100%. As a result, many trackers now offer incentives to clients, such as discounts on the lead premiums, encouraging the use of the tracker capacity. The end client cannot be forced to purchase cover from tracker portfolios but can be encouraged and incentivised to do so, subject to any duties that the broker will owe to the insured. The coverholder can also take steps such as communicating the benefits of utilising the tracker to both brokers and clients in areas where indexation is poor. Stating the obvious, giving discounts to lead premiums and additionally payments for participating on the tracker will mean that the portfolio will track at a higher loss ratio than an open market lead on the same business.
Should client declinatures count negatively against indexation?
As discussed above, indexation is a measure of how well the coverholder is deploying the capacity. If a client chooses to decline the portfolio tracker’s capacity, should the coverholder be penalised for this, given it is out of the coverholder’s control? Some suggest that client declinatures should be de-scoped and not be included within the denominator. This would support 100% indexation being achievable to the coverholder based on factors that are within their control.
However, this may devalue the indexation metric. Furthermore, clients may be sceptical about the optionality of portfolio trackers should they see that portfolio trackers are achieving 100% indexation, as clients should always have the final decision as to whether they opt to take it up. However, a proposed workaround for this is having separate indexation measures including and excluding client declinatures, so that declinatures outside the control of the coverholder are not taken into account. Overall indexation may be 85%, but excluding client declinatures, coverholder indexation may be much higher, again adding further context to the final metrics.
Should reduced lines following aggregate limit restrictions count negatively against indexation?
Contractual aggregate exposed limits and modelled limits are often set upfront based on the anticipated portfolio, so that underwriters can manage their exposure and purchase appropriate reinsurance. Coverholders monitor utilisation relative to these limits, and if they are nearing these limits, they may cut back on line sizes or decline risks in some regions. If the coverholder was not proactive in assessing changes in the portfolio throughout the year and addressing any requests to increase limits in advance of any concerns, then any remedial action of reducing line sizes/declining risks may count negatively on indexation.
If, however, a small limit was deliberately set by underwriters due to appetite, then any reduction in capacity as this limit is neared may not count against the coverholder from an indexation perspective (though the line size should have been reduced for that class/region to manage this in a controlled way).
How should premium indexation be calculated?
Ideally, premium indexation should be measured using the GWP for the portfolio trackers’ participation. For large programme limits, the % line sizes will often be restricted by the $ limits, and the in-scope premium for the portfolio tracker will depend on the programme structure. What is deemed the in-scope GWP to the portfolio tracker can therefore change significantly from the pipeline stage until the risk(s) have bound, as policies become in/out of scope and premiums are negotiated. For NTUd risks, the only way to determine this in-scope GWP would be to quote the portfolio tracker lines retrospectively based on the bound policies, which would often be a manual exercise and difficult to regularly review.
Where premium indexation is presented using 100% GWP for the in-scope policies, rather than calculating the portfolio trackers’ participation based on realistic %/$ lines, this does not truly reflect the premium indexation across a portfolio as the outcome would result in very high premium programmes unfairly skewing the premium indexation results even if the tracker line sizes in scope were small.
Acknowledgements
The LMA would like to thank the members of the CUO Committee and the CUOC Enhanced Underwriting Subcommittee for their contribution to this report. Thank you in particular to Colum D’Auria and Elinor Taylor.
Navigating the risks of enhanced underwriting – ICLG Insurance & Reinsurance 2026
24th February 2026
The LMA has contributed an Expert Analysis chapter to the International Comparative Legal Guide (ICLG) to Insurance & Reinsurance 2026.
The chapter, Navigating the risks of enhanced underwriting, examines the risks associated with enhanced underwriting and is now available to read below.
Enhanced underwriting models are reshaping how risks are selected, priced and bound, offering significant operational efficiencies. To support these varying models, managing agents continue to rely on established placement frameworks as the underlying contractual infrastructure. This chapter explores how these long-standing contractual mechanisms interact with new system-driven underwriting processes and where key risks may emerge.
Lead and Follow in the Lloyd’s and London Market: Beyond the Binary
11th February 2026
Executive summary
This report challenges the binary lead-follow construct, replacing it with a nuanced, six-segment categorisation based on insurers’ strategic positioning and capabilities. We distinguish true leadership from technical position on a slip, acknowledging that while most underwriters aspire to lead, this can mean different things to different people. Generally, as you move from left to right across the strategic positions, relevance to brokers decreases. Every position in this framework – from the Full-Service Lead to the critical provider of capacity – represents a commercially valid and essential contribution to the market’s collective strength, and we increasingly observe capital seeking to support specific models of underwriting.
We believe the industry may be misjudging the reality of where their underwriting teams sit on this lead-follow spectrum. Survey respondents claim to lead roughly 40% of their gross written premium (GWP); however, an outside-in assessment reveals that much of this business is not true lead but rather written as a Capacity Lead: leading slips on a technical basis without truly engaging with the client or intermediary and shaping the risk. This disconnect is particularly visible in the Influential Follower segment, which some interviewees dismissed as a myth designed to appeal to underwriters’ pride while they simply provide additional, interchangeable capacity. In a rapidly changing market, it is these Capacity Lead and Capacity Follow roles that are most susceptible to the twin trends of facilitisation and digital trading.
Capabilities that count
What do clients and brokers actually want from their leaders? It is rarely simply capacity. Clients want leaders who have the depth of technical expertise to understand their business and risks without lengthy explanations, and who can offer practical, cost-appropriate solutions. Brokers share these priorities but also look for speed, a credible expert they can present to clients and a reputable name that facilitates efficient risk placement. The most sophisticated insurers are deliberate about their lead proposition, aligning investments in technical and operational areas to capabilities they believe will allow them to differentiate themselves in each class of business – such as speed of response, nuanced pricing and claims expertise. Notably, the era of the ‘big name’ underwriter appears to be in decline; true leadership is now increasingly viewed as an institution’s collective depth of underwriting capability and claims handling rather than individual superstars.
The strategic imperative: defining a lead maturity journey
Maintaining strategic resilience in a fast-changing marketplace necessitates a frank assessment of current positioning across each of the six lead-follow segments. To avoid self-misclassification, sophisticated players combine quantitative and qualitative analysis with an internal and outside-in view. As a starting point, we have developed a set of questions that CUOs can ask of each class. Once the current state is established, CUOs can create lead maturity plans and target investment.
A mixed picture: fees and formalisation
While leading incurs higher operating expenses and deeper investment, the market is divided on the desirability of open market leaders’ fees. For most interviewees, potential premium upside is outweighed by the impact on follow book economics and questions around legal liability. There is also little appetite for formalising the role of the lead, with concerns that this could entrench established leaders and curtail innovation. A free-market approach, where insurers seek to build differentiating lead capability in diverse ways, is seen as a strength of the Lloyd’s market.
Anticipating market consolidation
65% of market participants anticipate a consolidation of the number of lead underwriters over five-to-ten years. This shift is driven by the increasing bifurcation between lead and follow, a softening market and the rising economic thresholds required to sustain a competitive lead proposition. Traditional followers who duplicate the activities of the lead face an existential squeeze as the market matures; the continued growth of fast follow is automating the ‘tail’ of the slip, necessitating a more efficient operating model for those not in a ‘true lead’ position. Consequently, leadership at Lloyd’s is evolving into a deliberate and highly focused strategic choice. The mandate for insurers is therefore to pursue an honest ‘lead maturity journey’. Success will depend on the ability to distinguish between underwriting classes where an insurer can realistically excel as a true lead and those where it is more advantageous to pivot to an efficient, low-cost follow strategy. Those who make their strategic choices deliberately, supported by an honest appraisal of their capabilities, will be the ones to shape the next chapter of this market.
In 2025, the LMA worked closely with managing agents, Lloyd’s, regulators and the wider (re)insurance ecosystem to enable the success of our members and the market. We advanced the simplification and digitisation of the market, strengthened our policy and regulatory influence, supported and represented Lloyd’s underwriters, and continued to invest in the talent pipeline that will shape the future of the Lloyd’s market.
Advocating for managing agents on Velonetic re-platforming
We played a central role in representing managing agents’ needs for the go-live of Velonetic re-platforming Phase One programme of work in 2025:
The Exit plan agreement was issued to all managing agents, enabling Velonetic to progress its work in 2025.
We started negotiations for the renewal of the FERN central services contract, which expires at the end of 2026. This will require material outsourcing notification (MON) for the regulator and will involve vendors, customer panels, signing co-ordination and legal reviews.
We clearly defined the needs for testing and customer engagement – for example, notification timelines for resource allocation agreed with Velonetic and the need for quality assurance, leading to improvements in testing application and maturity.
A full data copy was reviewed and approved to allow a copy of heritage data to be transferred to the new environments for Velonetic re-platforming. This allowed for data profiling and informed the ongoing software development work.
Velonetic central services pricing negotiations concluded successfully, securing a 10% gross reduction in Velonetic message-processing fees in 2026 for managing agents. The contract value is approximately £80m per year for the Lloyd’s market.
We also continued to press for a clearly defined Lloyd’s data strategy as part of the Lloyd’s strategy.
Progress on data standards and Core Data Record (CDR) adoption
Treaty CDR and Claims CDR were published, and the Claims CDR is now out for consultation. The consultation work concludes in Q2 2026 for delegated authorities.
A cross‑market coalition was established, bringing together brokers, managing agents, the company market and Lloyd’s to test and implement CDRs in specific use cases to help guide the “how to” of adoption and implementation.
Simplifying reporting for managing agents
We continued to advocate for simplification of Lloyd’s reporting, including QMA (financial statement returns), QMB (performance data) and Solvency UK implementation.
Computable Binding Authority Agreement contracts
Good progress has been made, including the creation of 400+ revised binding authority wordings, with publication of final wordings and the data information model scheduled for 2026.
Streamlined compliance for coverholders
Working with Lloyd’s, we agreed the initial question set for streamlined compliance, with ongoing reviews to simplify and implement using a central system. This approach is designed to drive simplicity and apply ‘ask once, share with many’ principles for coverholder compliance work.
Operational resilience
Working with Lloyd’s and the regulators, we have supported the April 2025 go-live and benchmarking for operational resilience across the market. We are also leading shared vendor testing for market participants.
2. Leveraging the market’s technical expertise to influence policy
Strengthening LMA’s global policy footprint
2025 saw major progress in regulatory and policy engagement:
Extensive engagements with Lloyd’s Insurance Company (LIC) in Paris and Brussels, including EIOPA, Insurance Europe and the Global Federation of Insurance Associations.
Deepened relationships with Lloyd’s Europe and Lloyd’s US.
Played a pivotal role in shaping and delivering LIC’s Funds Withheld model, successfully securing full adoption across all managing agents.
Consumer definition and regulatory competitiveness
We lobbied European and UK regulators on changes to their definition of ‘consumer’ as part of a broader drive towards a competitive regulatory framework for specialty insurance.
Improving oversight, culture and claims practices
Working closely with Lloyd’s, we secured agreement on annual change cycles for Principles for Business Oversight, supporting smoother transitions for managing agents.
Advocacy on business planning and capital oversight
A pilot with Lloyd’s for a three‑year business planning model was initiated, laying the groundwork for a move toward continuous oversight.
Representing members’ interests to regulators
We reviewed 244 consultations and submitted 66 responses on behalf of LMA members. Our challenge and advocacy resulted in several important changes, including:
Pull back on the FCA’s policy approach to Name and Shame and Non-Financial Misconduct.
Reduction in the scope of the Consumer Duty and widening of ‘Bespoke’ definition.
Removal of Lloyd’s two-stage complaints process.
Managing agents being out of scope for solvent exit planning.
Commercial business being excluded from the Financial Ombudsman Service levy.
3. Supporting, engaging, representing and finding solutions for Lloyd’s underwriters
Committee and wordings leadership
We helped resolve market issues raised through the committee matrix and our wordings work. 4,000 individuals were actively involved in 70+ LMA committees and we published 120 model wordings in 2025.
Events and knowledge sharing
Across the year, we published several in-depth thought leadership and research reports on topics including, enhanced underwriting, Lloyd’s results analysis, systemic cyber risk, artificial intelligence and trade credit claims.
In August, we launched the new LMA website, providing members with a more modern and improved user experience.
4. Increasing the market’s technical expertise and broadening its talent pool
Claims talent strategy
Our online claims job simulations attracted 2,500 new potential entrants into the claims talent pipeline, significantly widening market reach. We launched a video series showcasing professionals from a range of disciplines sharing their journeys, perspectives and advice for those considering a career in claims.
LMA Academy expansion
2025 was a milestone year for our award-winning LMA Academy, with six new courses launched and 67 events delivered to 1,181 delegates, totalling 12,580 hours of training across the Lloyd’s market. We also introduced the Early Talent Kickstarter Programme – an immersive four-week development programme for early-career professionals.
Supporting female underwriting talent
We supported the market in progressing Lloyd’s executive director targets, particularly for female underwriters. We spotlighted the declining senior female pipeline through a dedicated video series featuring female leaders, targeted media articles and events exploring the issue, including our sell-out Underwriting Talent Summit in November – and provided firms with practical actions to help strengthen their pipelines.
Looking ahead to 2026
The Lloyd’s market continues to evolve at pace and the LMA’s role is to ensure that managing agents have a strong, unified voice in shaping its future. We bring the market together to build consensus on complex issues, ensuring that the solutions we advocate deliver real benefit to our members. Our 2026 priorities reflect this commitment, focusing on underwriting innovation, strengthening technical expertise, simplifying processes through digitalisation, and influencing regulatory frameworks to protect and enhance the market’s position globally.
Understanding AI Exposures: AI Loss Scenarios Survey Results
In the absence of market underwriting and claims data on AI exposures, the Lloyd’s Market Association (LMA) conducted a market opinion survey to explore key issues relating to insured AI risks.[1] The survey explored:
whether insureds are using AI, right now, in ways that could cause or contribute to claims
which loss scenarios LMA members are most concerned about
views on whether or not insureds are managing the risks adequately
views on the potential scale of losses.
The survey was conducted in mid-2025, with responses invited on a wide range of potential AI loss scenarios (see Annex A for the full list). Four scenarios have been included in this analysis:
Professional Indemnity: “AI produces erroneous advice/service to clients, causing a loss.”
Product Recall: “Recall required following property damage and/or bodily injury caused by defective products designed and/or manufactured by AI, e.g. food contamination.”
Accident and Health (A&H): “Self-driving car error causes injury to passenger: first-party A&H policy could respond in first instance.”
Cyber: “System downtime caused by AI malfunction and resulting Business Interruption.”
Results
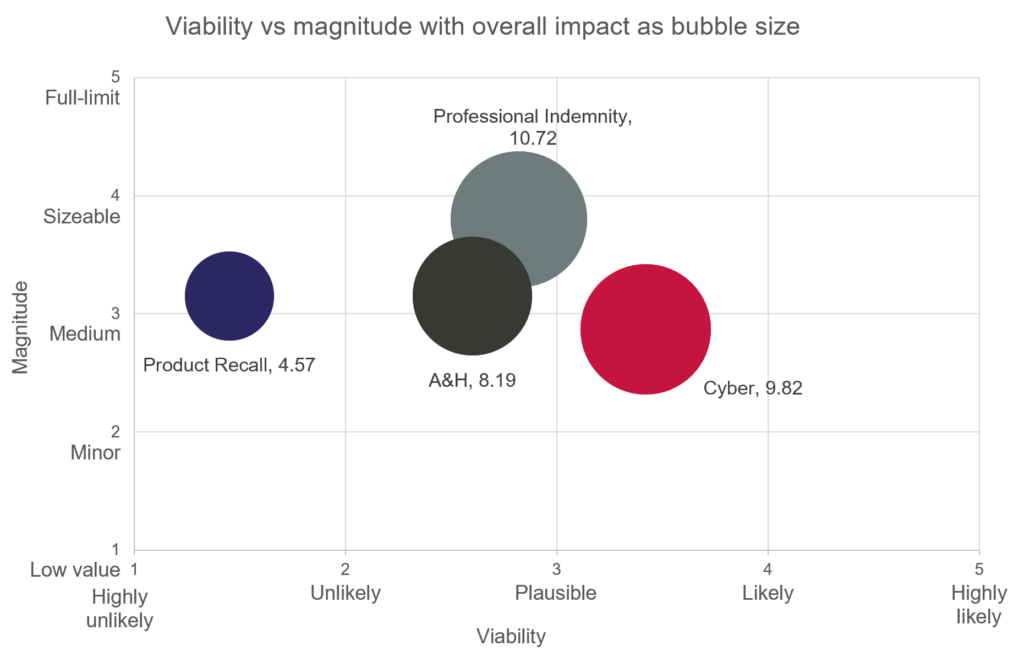
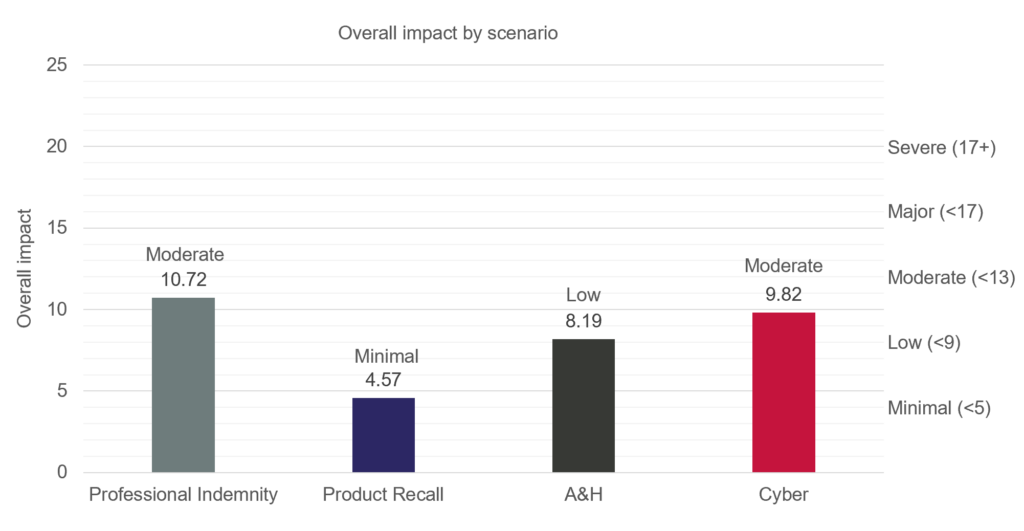
Based on the opinions provided by LMA members to the survey (of which 94% were underwriters), each scenario has been rated for viability (score out of 5), magnitude (score out of 5) and overall impact (score out of 25; see methodology for further information).
Viability
Magnitude
Overallimpact
Professional Indemnity
2.82: Plausible
3.8: Medium
10.72: Moderate
Product Recall
1.45: Highly unlikely
3.15: Medium
4.57: Minimal
A&H
2.6: Plausible
3.15: Medium
8.19: Low
Cyber
3.42: Plausible
2.87: Minor
9.82: Moderate
Answers to research questions
Are insureds using AI, right now, in ways that could cause or contribute to claims?
Yes.
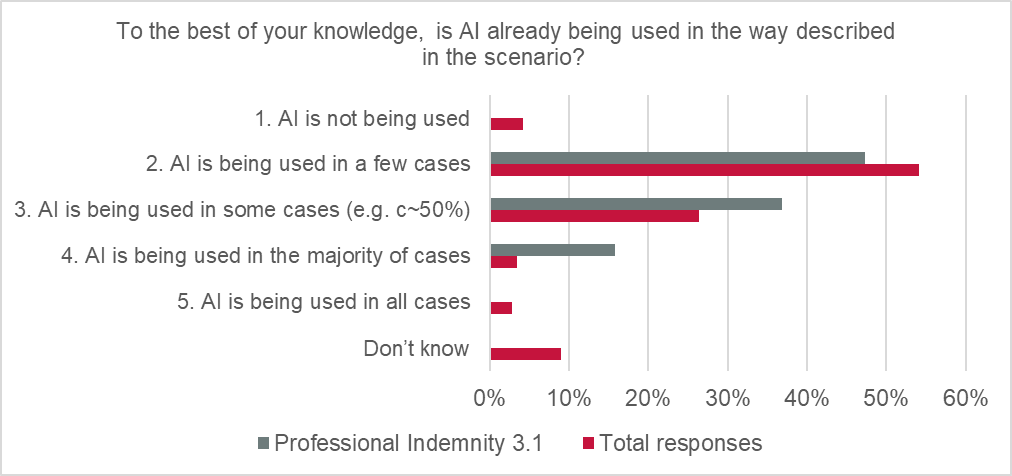
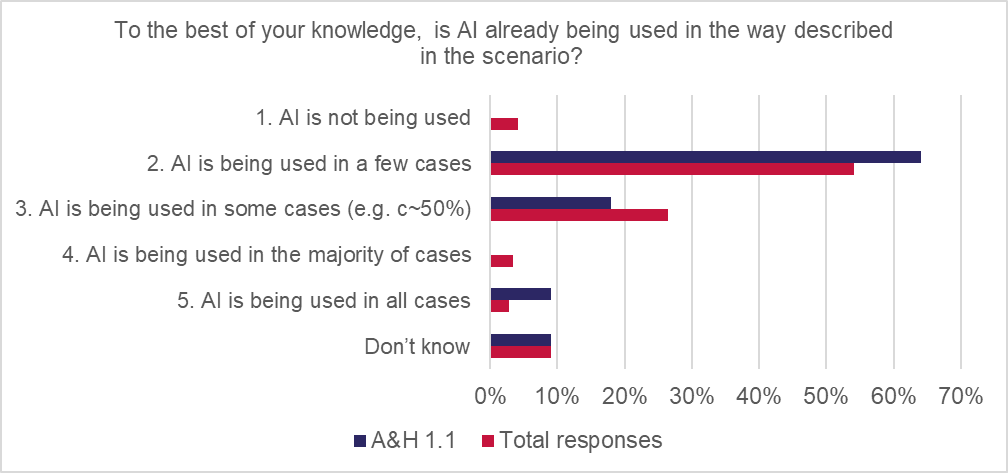
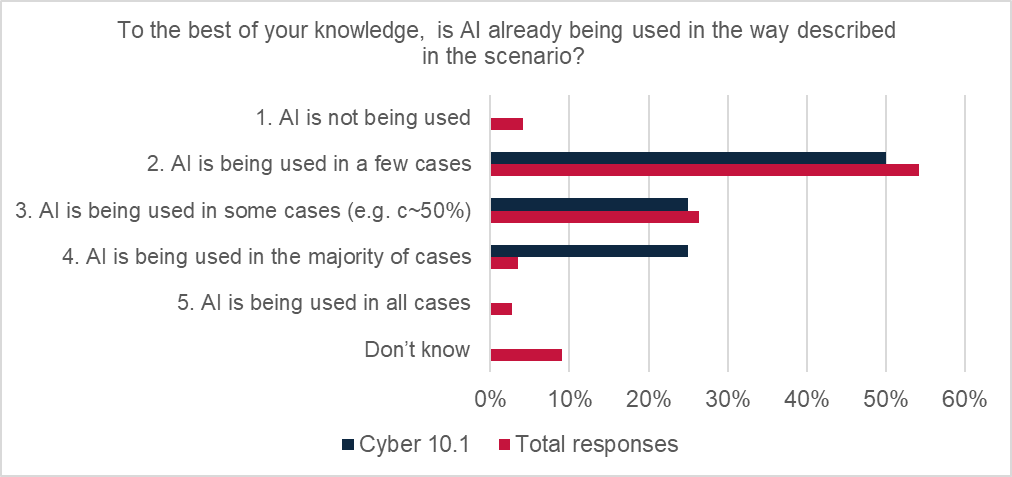
Three of the four scenarios (Professional Indemnity, A&H and Cyber) were rated as “plausible” (the middle rating on the five-point scale), indicating that respondents felt that these loss scenarios could occur in real-world settings but were credible risks rather than “likely” or “very likely”.
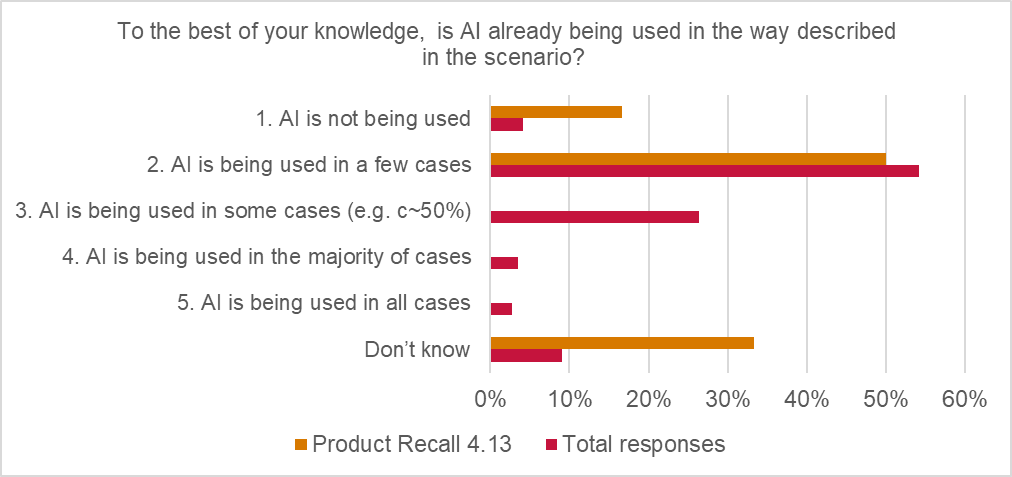
The Product Recall scenario was rated as “highly unlikely” for viability, perhaps indicating that insurers do not believe that insureds are generally using AI, at present, for product design or manufacturing, in ways that could lead to insured losses caused by AI errors.
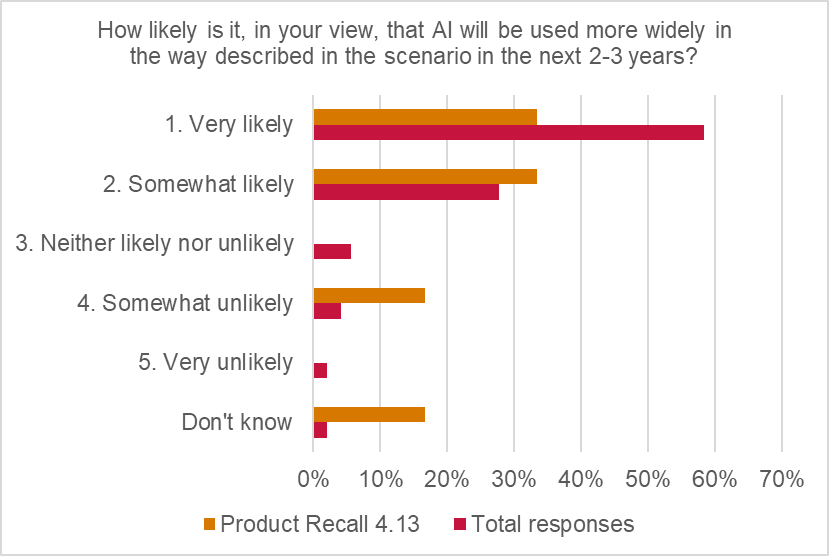
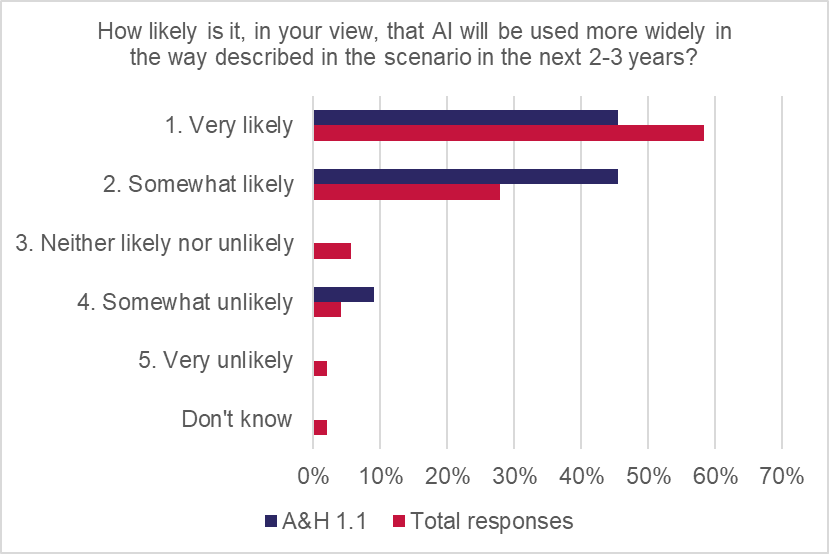
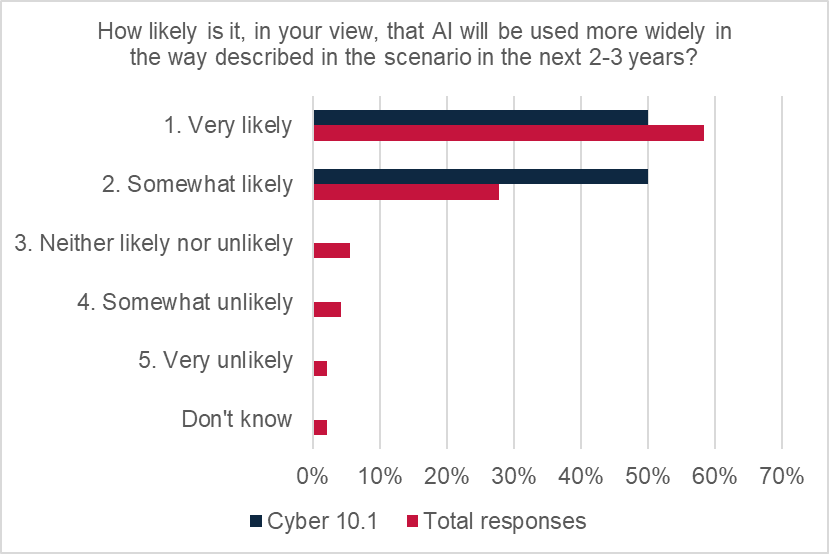
The survey also indicated that AI usage (in the ways described in the scenarios) was expected to increase, which could increase exposure to AI error-driven losses in the future. 67% of the total responses agreed that AI usage would increase in the next 12 months and 86% agreed that AI usage would increase in the next two to three years.[2]
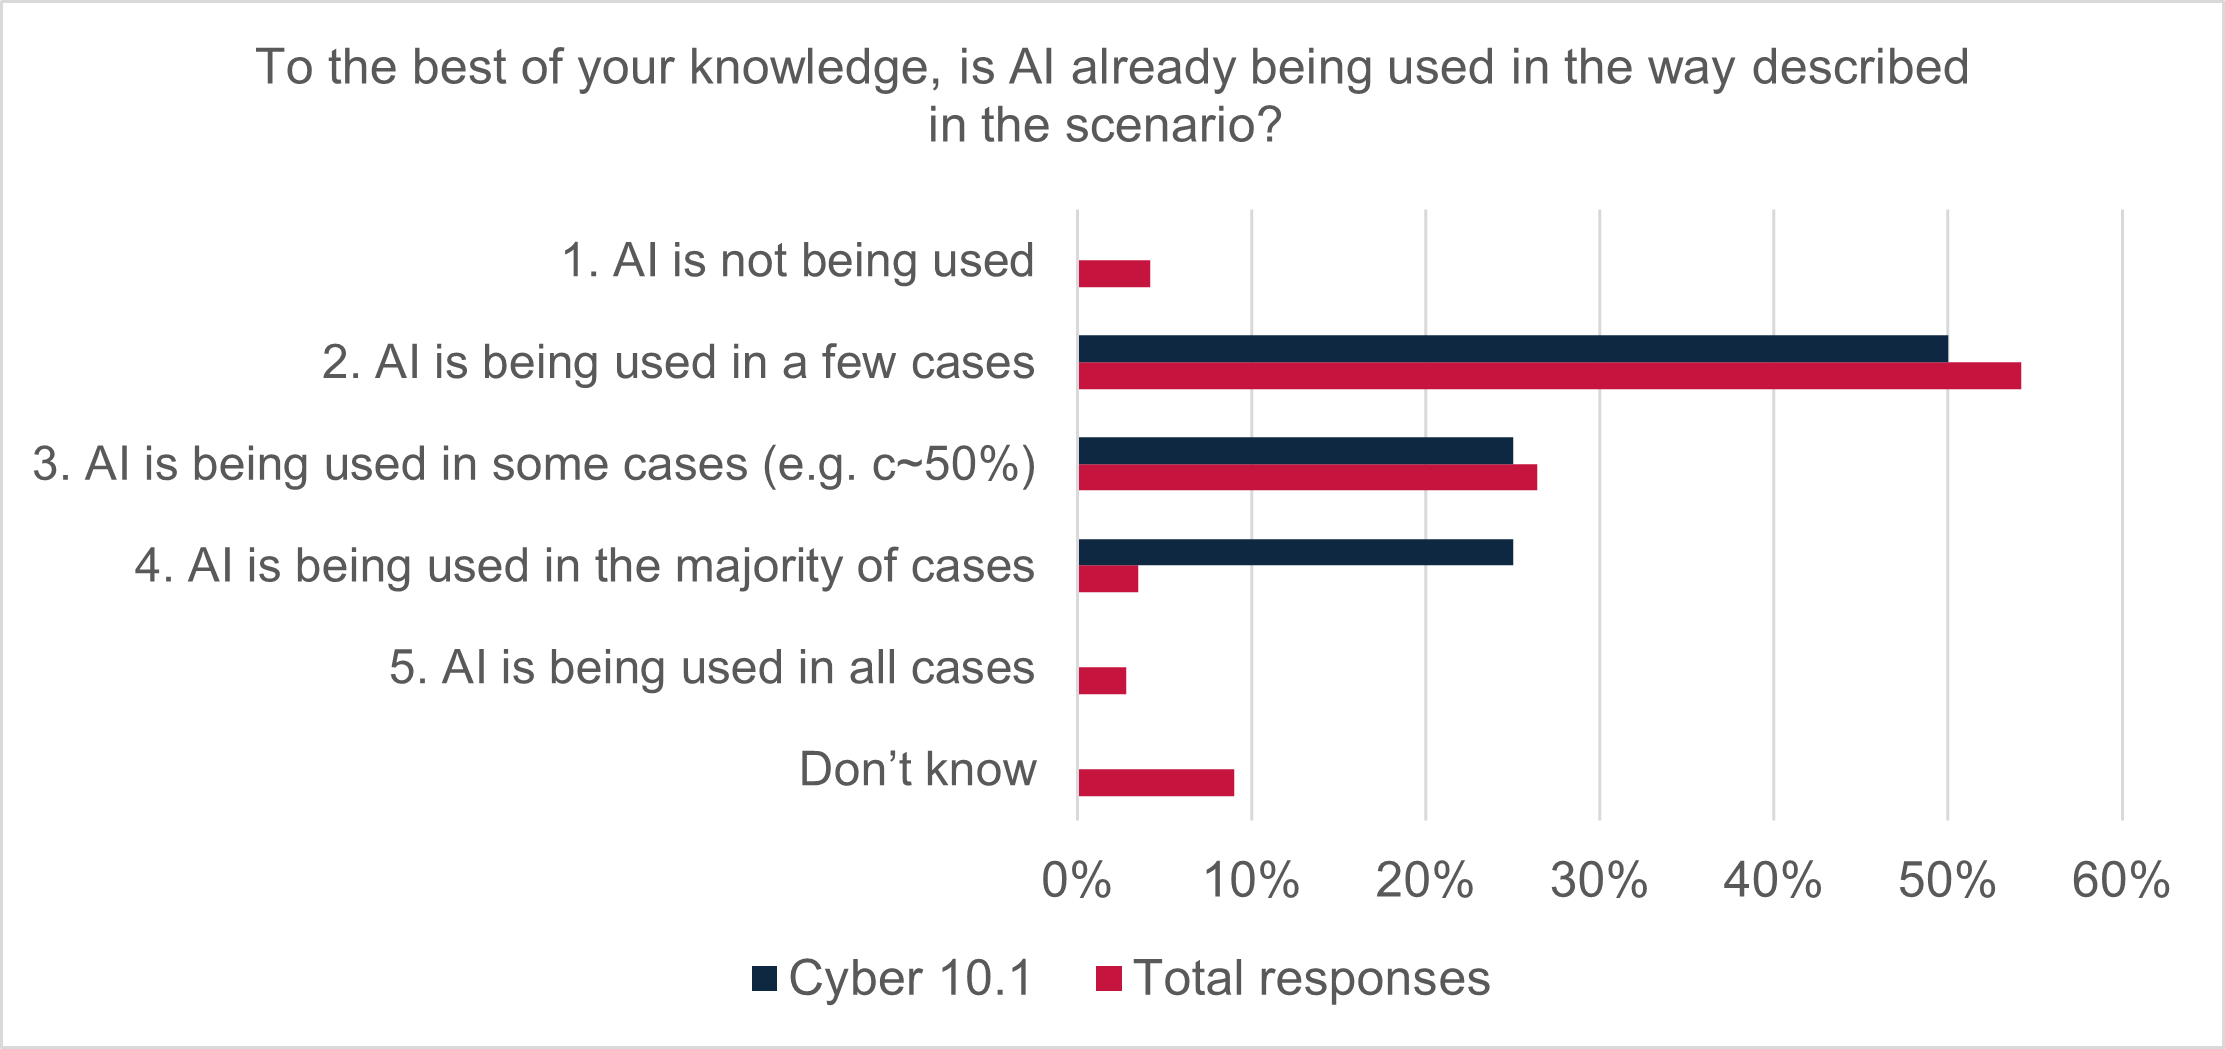
Respondents to the Professional Indemnity scenario indicated more regularised use of AI in financial and professional lines at present, compared with other product areas, with 100% of responses suggesting AI was being used, at least to some extent, right now by insureds. 79% of responses also suggested AI usage is expected to increase over the next 12 months.
In Product Recall, live exposure to risks arising from use of AI in product design or manufacturing is currently viewed by respondents as low. However, significant growth potential is expected in the short to medium term.
Respondents to the Cyber scenario agreed that there was at least some degree of system failure risk posed by AI usage at present.
Note: This survey did not assess any protective effects of AI use – the focus was on loss potential only.
Which loss scenarios are LMA members most concerned about?
Of the four scenarios in this summary, the Cyber scenario received the highest score for viability, while the Professional Indemnity scenario received the highest scores for both magnitude and overall impact. The overall impact ratings (calculated by multiplying the viability ratings by magnitude ratings) scored the Professional Indemnity and Cyber scenarios as “moderate” (the middle rating, in between “low” and “major”).
Respondents generally agreed that there is considerable potential for AI-related losses to arise in the provision of professional services, given the wide usage of AI large language models by insureds.
The potential overall impact of the product recall scenario was rated as “minimal” and the A&H scenario was rated as “low”.
Note: The level of concern/scale of any loss would also depend on the terms and conditions of applicable wordings and use of exclusions. In these scenarios we did not ask respondents to apply a specific wording, given a wide range of cyber clauses are in use in most lines of business. When estimating loss potential, we asked respondents to assume that the loss was covered. Also see Section 5: Treatment of AI risk in LMA model wordings.
Are insureds managing the risks (of AI errors causing insured losses) adequately?
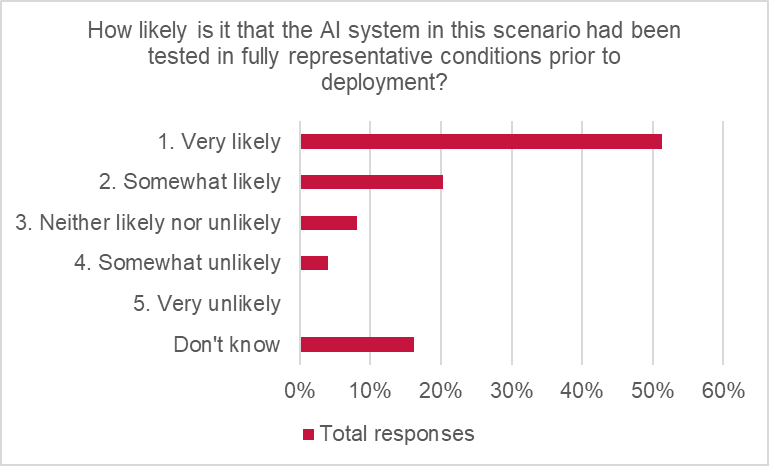
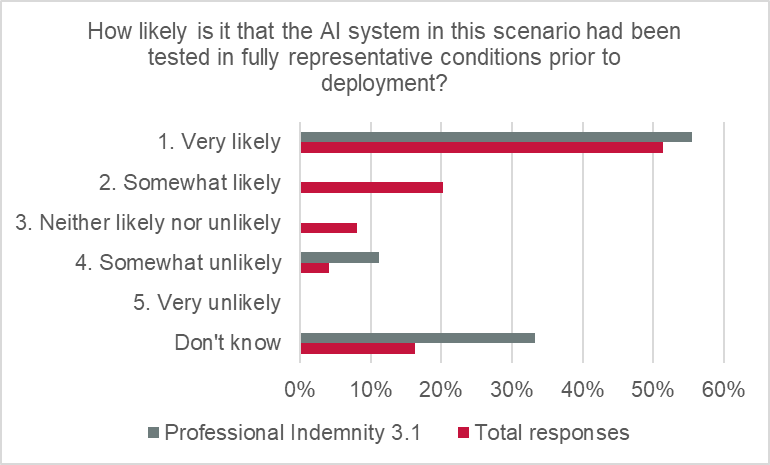
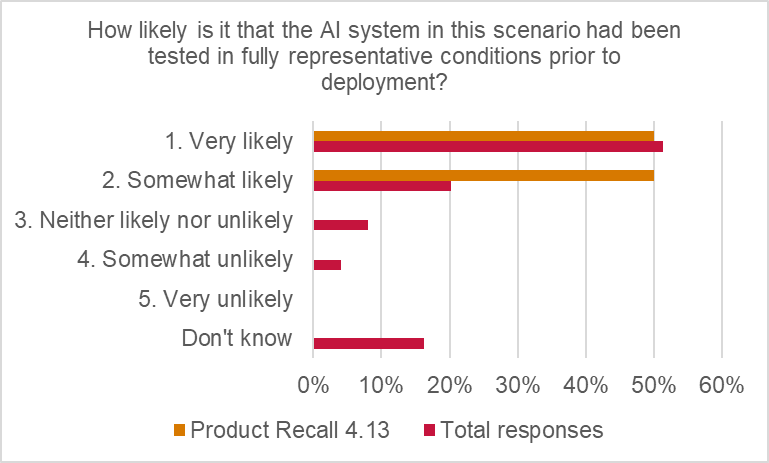
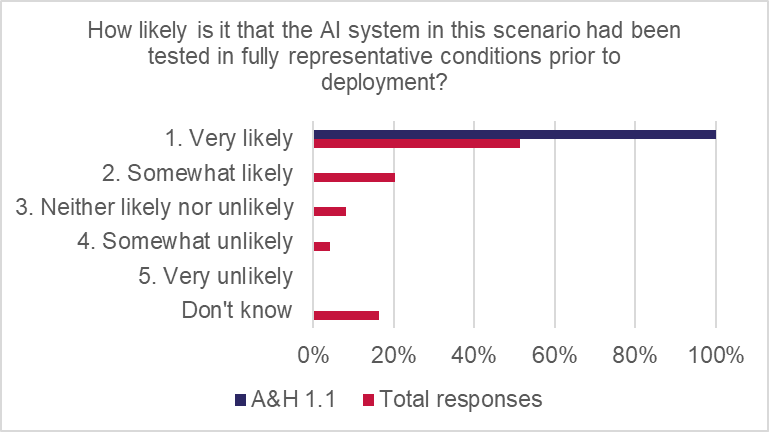
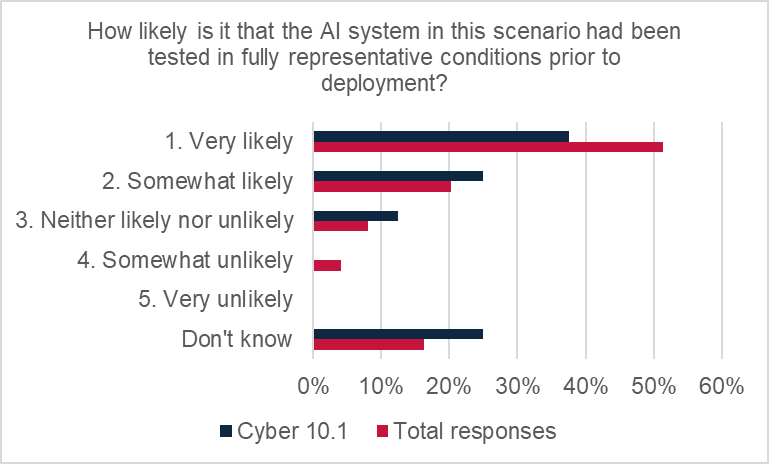
LMA members believe that they largely are, with some variability. The total responses indicated reasonable confidence that insureds were testing AI use in representative conditions, with more than two-thirds of responses suggesting it was “very likely” (51%) or “somewhat likely” (20%).
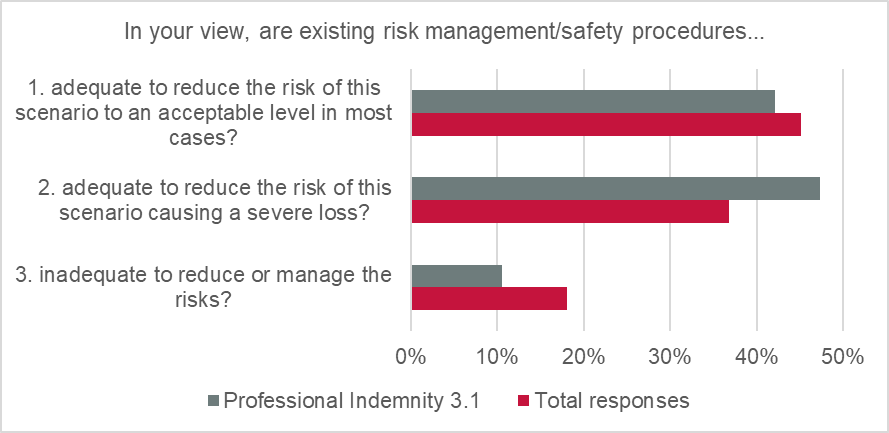
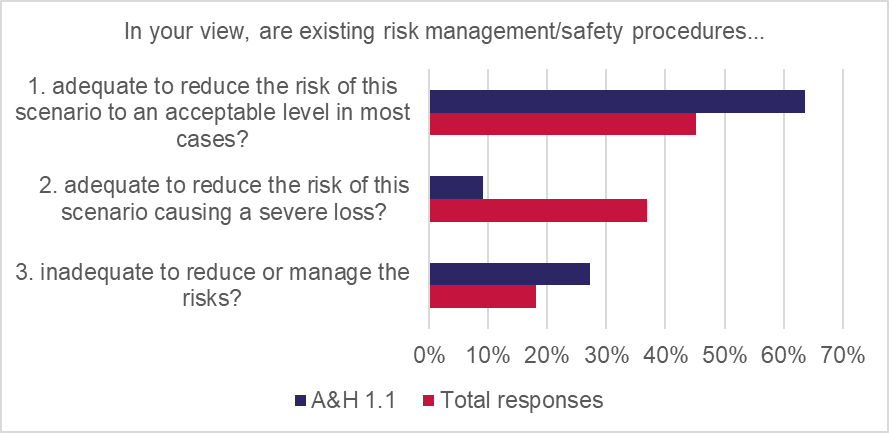
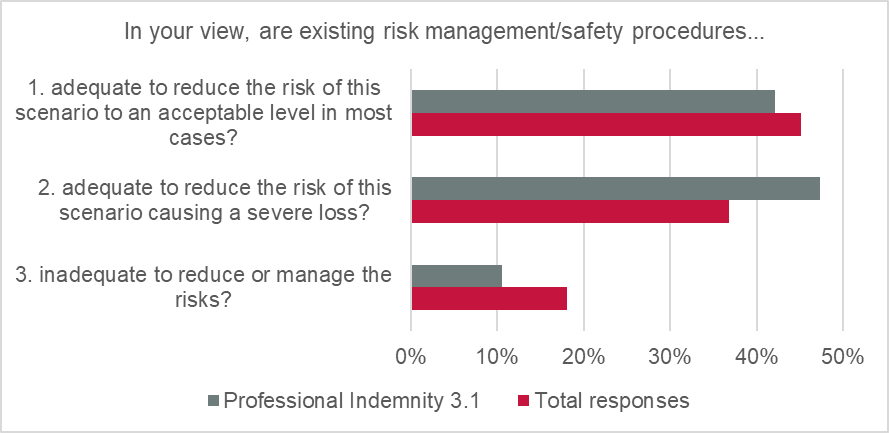
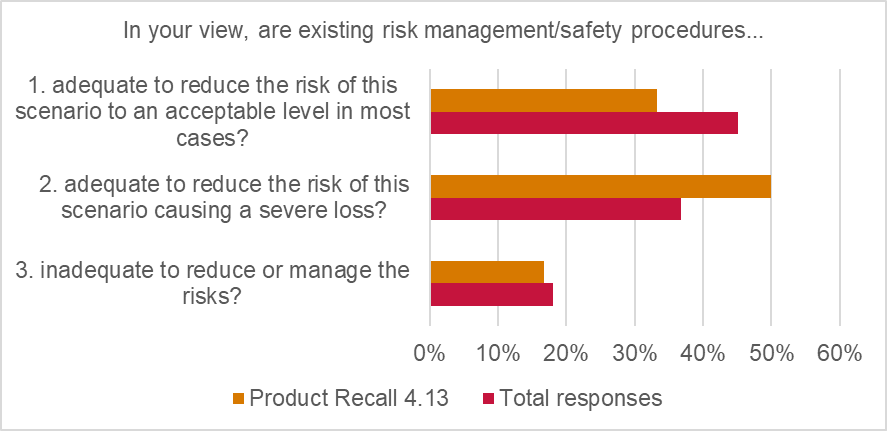
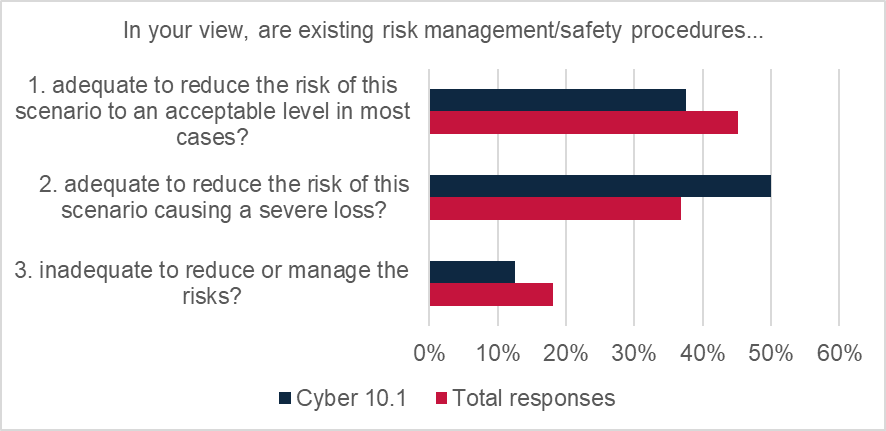
Only 18% of global responses suggested that insureds’ existing AI risk management/safety procedures are inadequate. The majority of responses indicated that risk management is either “adequate to reduce the risk to an acceptable level in most cases” (45%) or “adequate to reduce the risk of this scenario causing a severe loss” (37%).
In the Professional Indemnity scenario, 89% of respondents felt that existing risk management/safety procedures were “adequate” (vs 11% “inadequate”). This indicates a high degree of confidence in insureds to manage the risks arising from use of AI systems.
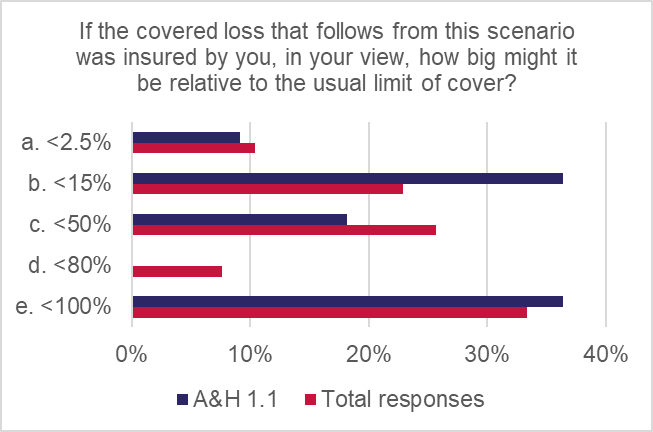
In the A&H scenario, where losses arise due to an accident caused by a self-driving vehicle (and given the obvious risks arising from AI failure in this scenario), it is reasonable to expect extremely careful risk-management strategies to be deployed. The majority of respondents support this hypothesis, with 64% of responses agreeing that testing by risk managers was adequate to reduce the risk to an acceptable level “in most cases” and 9% said testing was “adequate to reduce risk of causing a severe loss”. However, 27% said that testing was “inadequate to reduce or manage risks”, so this confidence was not universally shared.
Note: The survey explored the confidence levels/opinions of respondents regarding insureds’ risk management. The survey did not collect risk management data, claims information or data from external sources.
Respondents’ views on the potential scale of losses?
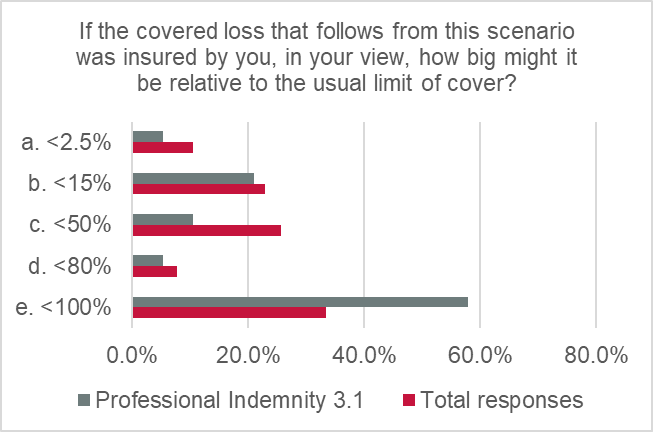
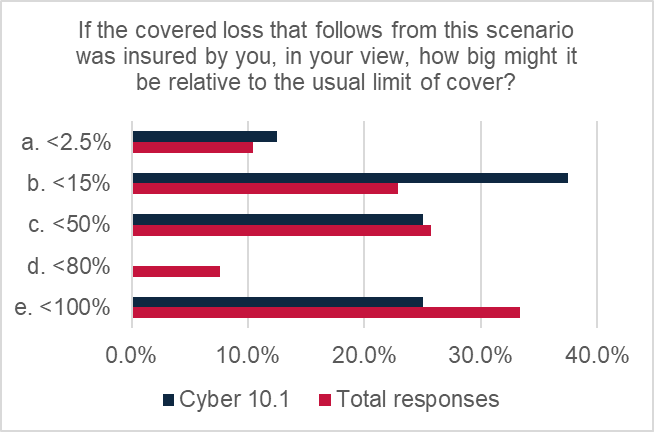
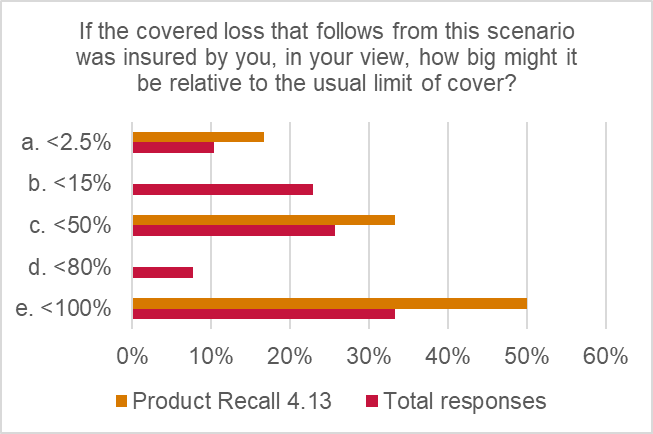
The magnitude ratings for all scenarios were either “medium” or “minor”, with respondents clearly not fearing full-limits exposure, based on weighted-averages (note: although there were a wide range of views on the loss potential of each scenario – see detailed analysis below).
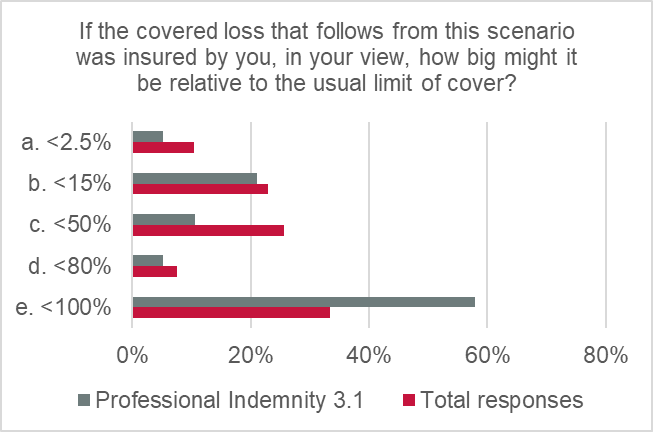
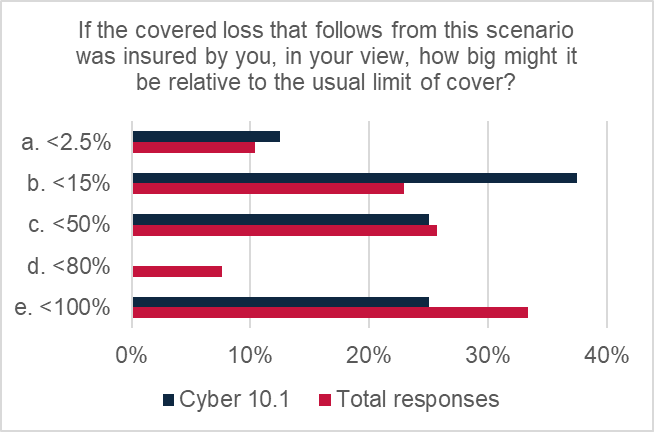
The Professional Indemnity scenario produced the highest magnitude rating of 3.8 out of 5, at the higher end of the “medium” rating. The potential for losses was estimated as reasonably significant, with 58% of responses of the view that losses arising from this type of scenario might reach full policy limits (vs 33% of the total responses) and 5% of responses estimated that losses might be around 80% of policy limits.
Despite attracting the highest score for viability, the Cyber scenario’s magnitude rating was “minor” (2.87 out of 5), indicating the view from respondents that this scenario is likely to produce relatively low-level losses, with over a third of respondents suggesting a loss might scale at 15% of typical policy limits. However, one quarter indicated losses arising from this type of scenario might reach full policy limits.
Note: These observations are indicative of the views of the survey respondents and have been extrapolated to make general observations in some cases; the actual values of any individual loss would depend on the circumstances, policy wording, applicable terms and conditions, limit of coverage, etc.
Treatment of AI risk in LMA model wordings
Drawn from a related piece of work commissioned by the LMA Chief Underwriting Officers’ Committee, Section 5 of this paper sets out a high-level analysis of potential AI exposures arising in LMA model Cyber wordings. A summary table of the current position is set out in Annex 2.
Conclusions
The risks presented by the AI loss scenarios reviewed in the survey attracted, on the whole, only a modest degree of concern amongst underwriters. The risks were widely expected to grow in the future.
Respondents felt that the Professional Indemnity scenario was the most concerning of the scenarios reported on and Product Recall was the least concerning.
Testing and risk management by insureds is key to ensuring that the risks are managed to an acceptable level.
The survey attracted a wide range of views and there is a lack of underwriting and claims data about AI exposures. Case studies, with detailed event profiles, applying specified wordings and limits of cover may usefully reveal more information about potential AI exposures.
Disclaimer
This document has been produced by the Lloyd’s Market Association (LMA) for general information purposes only. While care has been taken in gathering the data and preparing the document, LMA makes no representations or warranties as to its accuracy or completeness and accepts no responsibility or liability for any loss arising as a result of any reliance placed on the contents. This document does not constitute legal advice.
[1] The LMA definition of AI, for the purposes of this survey, is: “software that is automated and generates information outputs based on a statistical model of data taken from similar or informative scenarios”. See introduction below for further information.
[2] “Total responses” refers to all responses across the entire range of scenarios
Introduction
Artificial intelligence (AI) systems and tools have been an extremely hot topic in insurance for several years and are likely to remain so for the foreseeable future. Many boards of Lloyd’s managing agents have recently cited AI risk as second only to geopolitical risks on risk registers.[1] In order to explore some of the key themes emerging from insured AI risk, the LMA conducted a survey of members, asking for views across a range of potential loss scenarios.
Primarily, the survey was intended to research:
LMA members’ views on whether insureds were using AI, right now, in ways that could cause or contribute to claims
which loss scenarios LMA members were most concerned about
LMA members’ views on whether insureds were managing the risks adequately
members’ views on the potential scale of losses.
Definition of AI
The definition of AI used in the survey describes an AI system as “software that is automated and generates information outputs based on a statistical model of data taken from similar or informative scenarios.”
In the survey, respondents were encouraged to think about AI very broadly, including any computer system able to perform tasks that normally require human intelligence, under varying and unpredictable circumstances, without significant human oversight, such as visual perception, speech recognition, decision making and language translation. AI systems could include large language models, machine learning software and deep learning software.
Use of cyber affirmations and exclusions in policy wordings
The survey also collected some general views on whether AI exposures might typically be covered or excluded in policy wordings. The LMA previously explored this issue and briefed the LMA Chief Underwriting Officers’ Committee in 2024 on a high-level analysis of LMA model wordings exposure to a list of AI loss scenarios. An updated summary table of this work is provided in Annex 2.
Some high-level questions on the use of exclusions were included in the survey but are not reported in this summary. On review, it was not appropriate to report on generalised observations about coverage/exclusion of losses without narrowing down the scenario(s) to an exact set of circumstances and the exact clause that was used; this is outside the scope of the survey and would be more accurately researched via case studies.
Disclaimers
The observations reported in this summary do not relate to specific losses, wordings or exclusions. An authoritative view on coverage or exclusion of losses arising from a specific loss would require a review of the facts and circumstances and application of the policy wording(s) used.
Also, we did not explore the protective effects of AI in this survey, taking into account the benefits that could accrue to insureds and (re)insurers arising from the use of AI, which could be material.
A 31-question survey was developed and issued by the LMA to members in April 2025. Members were invited to select any of the listed scenarios and complete the question set and were encouraged to submit responses for any of the scenarios within their area(s) of expertise.
The LMA developed a lengthy suite of AI loss scenarios: 65 in total, across 10 high-level classes of business. Some scenarios were invented for this exercise and some were based on events that have (or may have) already occurred. The scenarios were validated with the LMA’s underwriting committees, to ensure that each scenario was believed to be technically viable, even where the probability of a particular scenario occurring was suspected to be very low.
The scenarios were deliberately broadly drafted, to try to encompass a wide range of AI use cases/loss scenarios and attract as many responses as possible, on the basis that this survey is exploring AI risks at a high-level only. For example, in the Professional Indemnity Scenario 3.1 “AI produces erroneous advice/service to clients, causing a loss”, the type of advice/service provided is not specified as the intention was to capture any type of advice or service provided to any type of professional client. This approach does have its limitations in terms of the degree to which the views and opinions captured might be generally applicable, but the intention was to capture high-level views on generic AI loss scenarios for major insurance products.
Respondents
144 responses to the survey were collected in Q2 and Q3 2025, 94% of which were from underwriters. The distribution of responses by job role was:
Leadership/C-suite: 12%
Head of Class/Senior Underwriter/Senior Manager/Senior Product Manager: 33%
Manager: 31%
Team member: 25%
Many respondents advised that the survey questions were difficult to answer. Not enough responses were collected to analyse every scenario included in the survey. Therefore, this summary focuses on the four scenarios with the highest response rate, with a minimum threshold of six responses per scenario, though up to 19 responses were received for some scenarios.
Respondents reported the survey as difficult to complete, for two main reasons:
Insurers are remote to insureds’ use of AI; it is not always clear whether an insured is using AI in the ordinary course of their business and little data on AI usage is currently collected during underwriting, so survey questions exploring this usage have relied on underwriters’ views and opinions rather than data.
There is a lack of claims data on AI contribution to losses, again meaning that the survey responses are informed by views and opinions rather than data in most cases.
Future research may be able to draw more directly on underwriting and claims data. However, the key observations arising from this survey still address the LMA’s overall goal of contributing to the sum of knowledge on AI risks and sharing the insights arising from this research with LMA members.
Scenario viability, magnitude and overall impact ratings
Each of the four scenarios that feature in this analysis have been given a viability rating and a magnitude rating, to summarise respondents’ views on these core issues. The ratings are based on an assessment of respondents’ views on key questions in the survey, regarding whether the scenarios are believed to be technically possible or not, and the level of concern about the loss potential. An overall impact rating for each scenario has also been produced by multiplying the viability and magnitude ratings together.
The viability rating is an assessment of whether the scenario is believed to be technically possible or not, based on responses to questions that probed:
whether AI was thought to be in use in live situations, in the way set out in the scenario
if so, whether it was widely or narrowly deployed
whether AI was making “real-world” decisions.
The viability rating is expressed on a five-point Likert scale, using weighted average responses:
Viability rating
Rationale
1
Highly unlikely
Responses indicated that this scenario was highly unlikely to occur
2
Unlikely
Responses indicated that this scenario was unlikely to occur
3
Plausible
Responses indicated that this scenario was plausible
4
Likely
Responses indicated that this scenario was likely to occur
5
Highly likely
Responses indicated that this scenario was highly likely to occur
The viability rating also touches on potential frequency; the higher the score, the more likely respondents felt the scenario was to occur and produce a real loss event.
The magnitude rating summarises respondents’ opinions on the potential scale of loss, should the scenario occur for real. The rating is drawn from opinions received on the question exploring the potential scale of loss, expressed as a percentage of typical limits of cover. The magnitude rating is expressed on a five-point Likert scale, using weighted average responses:
Magnitude rating
Rationale
1
Low value
Responses indicated that this scenario could produce low-value losses only
2
Minor
Responses indicated that this scenario could produce minor losses
3
Medium
Responses indicated that this scenario could produce medium losses
4
Sizeable
Responses indicated that this scenario could produce sizeable losses
5
Full limit
Responses indicated that this scenario could produce full-limit losses
An overall impact rating for the four loss scenarios has been produced by multiplying the viability rating and magnitude rating of each scenario together. This rating is intended to summarise the respondents’ opinions on the potential overall impact of a loss scenario, reflecting views on both the viability of the scenario and potential scale of loss in the event the scenario occurred.
Overall impact rating
Rationale
<5
Minimal
Overall impact (per loss) estimated as potentially minimal
<9
Low
Overall impact (per loss) estimated as potentially low
<13
Moderate
Overall impact (per loss) estimated as potentially moderate
<17
Major
Overall impact (per loss) estimated as potentially major
17+
Severe
Overall impact (per loss) estimated as potentially severe
Note: The ratings are intended to be indicative of the opinions of respondents to the survey; they are not based on actuarial calculations or driven by claims, exposure or risk management data.
Key loss scenarios
Detailed analysis and commentary is provided below on four scenarios:
Professional Indemnity scenario 3.1: “AI produces erroneous advice/service to clients, causing a loss.”
Product Recall scenario 4.13: “Product Recall due toproperty damage and/or bodily injury caused by defective products designed and/or manufactured by AI, e.g. food contamination.”
Accident and Health (A&H) scenario 1.1: “self-driving car error causes injury to passenger: first-party A&H policy could respond in first instance.”
Cyber scenario 10.1: “System downtime caused by AI malfunction and resulting business interruption.”
Responses to each of the four scenarios have been collated into three areas of analysis:
The use of AI by insureds and growth potential in the near future.
Risk management.
Potential impact on losses.
For each of the four scenarios, a rating for viability, magnitude and overall impact has been provided. Please see Section 3 above for further information on the methodology of these calculations, as well as commentary on the trends and data points of interest.
Professional Indemnity scenario
Scenario 3.1:“AI produces erroneous advice/service to clients, causing a loss.”
Viability rating: Plausible (2.82 out of 5)
Magnitude rating: Medium (3.8 out of 5)
Overall impact rating: Moderate (10.72)
This scenario is deliberately broadly drafted and was intended to capture views on circumstances such as:
Incorrect tax advice provided to a client by an accountancy firm, due to a mistake made by AI software in analysing financial data.
Negligent legal advice provided to a client by a law firm, due to an AI program “hallucinating” (relying on non-existent case law).
Architectural blueprints containing material errors, supplied by a firm of architects that relied on faulty AI research.
Use of AI by insureds and growth potential
Respondents indicated more regularised use of AI in Professional Indemnity at present, compared with other product areas (excluding the Cyber scenario reported on below):
47% estimated that AI is being used “in a few cases”.
37% estimated that AI is being used “in some cases” (vs 26% of the total responses).
16% of responses indicate AI is being used “in majority of cases” (vs 3% of the total responses).
Use of AI is estimated to be growing more rapidly in this area than other products/scenarios; around 80% of respondents expected wider usage of AI in next 12 months (vs 67% in the total responses).
There were mixed views on whether AI was making “real-world decisions” at present.
Risk management
56% of respondents felt that it was “very likely” that adequate testing was taking place (vs 33% answering “don’t know”).
89% felt that existing risk management was “adequate” (vs only 11% “inadequate”); this indicates a high degree of confidence in insureds to manage the risks arising from use of AI systems.
Losses
The potential scale of losses was estimated as reasonably significant:
58% thought that losses arising from this type of scenario might reach full policy limits (vs 33% of the total responses).
5% estimated losses might be <80% of policy limits (the second highest category of loss valuation).
Observations and commentary
There is clearly considerable potential for AI-related losses to arise in the provision of professional services, given the wide usage of AI (e.g. large language models) by insureds. All respondents provided a positive response on the question of AI usage in the way envisaged in the scenario, although just under half felt that AI was only being used “in a few cases”. This combined view is indicated in the viability rating of “plausible”, with a weighted score of 2.73 out of 5.
However, there is some confidence in insureds’ management of this risk. The magnitude rating (which reports views on the potential scale of loss, per event) was “medium”, although a score of 3.8 does position the potential loss at the higher end of this bracket.
The overall impact rating for this scenario was “moderate”, with a score of 10.37, which was the highest rating of the four scenarios included in this analysis. This shows that the overall level of concern is in the middle of the scale, due to a combination of wide usage and the sizeable (but not severe) estimated potential scale of loss.
The risks envisaged in this type of scenario are not necessarily being considered as a new exposure by LMA members. Reliance on AI may be analogous to reliance on (for example) junior staff producing tax calculations, legal research or technical drawings. The difference with AI might be a matter of scale. We would also note that the key function of AI is to use computing speed and power to let the system do the work and overcome human limitations; the benefits cannot be fully realised if the output must be constantly overseen by human supervisors.
Product Recall scenario
Scenario 4.13:“Recall required following property damage and/or bodily injury caused by defective products designed and/or manufactured by AI, e.g. food contamination.”
Viability rating: Highly unlikely (1.45 out of 5)
Magnitude rating: Medium (3.15 out of 5)
Overall impact rating: Minimal (4.57)
This scenario was intended to collect views on product recall exposures that might arise from AI errors in a manufacturing process, such as:
Food production that leads to a contamination incident, due to (for example) a harmful amount of an ingredient being added to a food product.
Children’s toys being produced with sharp edges or abrasive or corrosive surfaces.
Construction/automotive products with defects that cause component failures under stress, leading to fire/explosion/physical damage.
The intention was to explore views on whether AI was being used in product design and manufacturing by insureds at present and the loss potential that might arise in the event of errors. Similar scenarios were posed in respect of general liability exposures in scenarios 4.6 and 4.11a (not included in this analysis).
Use of AI by insureds and growth potential
Respondents estimated that AI use is very limited in this type of scenario at present:
17% of respondents advised that AI was not being used in this way by insureds
50% of respondents selected only “in a few cases”
33% replied “don’t know”.
However, regarding growth potential:
50% of respondents expected strong growth in the use of AI (in product design and manufacture) in the next 12 months, and 67% in the next two-to-three years.
This indicates that while live exposures to risks arising from use of AI in product design/manufacturing were currently viewed as low, significant growth potential is expected, in the short to medium term.
Risk management
Respondents were reasonably confident that AI systems were being tested in representative conditions prior to deployment, with more than two-thirds of responses suggesting it was “very likely” (51%) or “somewhat likely” (20%). The assessment is very close to the total responses.
Moreover, the general view was that existing risk management by insureds was adequate. 33% of respondents indicated that risk management procedures were “adequate to reduce the risk of this scenario to an acceptable level”, while 50% indicated procedures were “adequate to reduce the risk of this scenario causing a severe loss”.
Losses
The potential for sizeable losses was estimated as fairly significant: 50% of responses indicated up to full-limit losses arising from this type of scenario and 33% of responses suggested “up to 50% of limit” losses arising from this type of scenario.
Observations and commentary
The assessment of current usage of AI in the way described in the scenario is reflected in the “highly unlikely” viability rating score (1.45 out of 5). Respondents did not think that AI is being used to make critical decisions in product design or manufacturing at present. However, it is interesting that respondents felt that the potential for large losses, per claim, was still present, hence the “moderate” magnitude rating (weighted score of 3.15 out of 5). There was clearly some concern about the potential scale of loss arising from this type of event, as indicated by a combined 83% of respondents concerned about up to 50%-100% of full-limit losses.
However, weighing the above two factors together, the overall impact rating is “low”, indicating that respondents were relatively relaxed about the overall risks presented by this scenario, dominated by views on the low degree of involvement of AI in manufacturing at present. The only cloud on the horizon is the strong anticipated growth of use of AI in product design and manufacture that is expected in the near future.
Accident and Health (A&H) scenario
Scenario 1.1: “Self-driving car error causes injury to passenger: first-party A&H policy could respond in first instance.”
Viability rating: Plausible (2.6 out of 5)
Magnitude rating: Medium (3.15 out of 5)
Overall impact rating: Low (8.19)
This scenario, suggested by the LMA Personal Accident Committee, was the top-rated concern arising from A&H underwriters in respect of AI exposures. It is noted that the primary scenario is, at its core, a motor insurance exposure. However, the committee felt that this scenario was sufficiently viable in respect of personal accident losses to include in the personal accident suite of scenarios, notwithstanding the potential for subrogation against at-fault parties (i.e. motor insurers, motor manufacturers, AI system suppliers) in subsequent cost-recovery actions.
Use of AI by insureds and growth potential
Use of AI was assessed as relatively low at present; over 60% of respondents were of the view that AI was being used “in a few cases” and 18% “in some cases”.
However, 64% of respondents said that AI would be more widely used in 12 months, and 91% said it would be more widely used over the next two-to-three years.
AI was believed to be taking real-world actions in real time in this scenario. 100% of responses agreed that AI would decide which real-world action to take, with the distribution evenly split between “very likely” or “somewhat likely”.
Risk management
Respondents had strong confidence in testing by product manufacturers: 100% said testing was being done in representative conditions. 64% of responses said that testing by risk managers was adequate to reduce the risk to an acceptable level “in most cases” and 9% said testing was “adequate to reduce risk of causing a severe loss”. However, 27% said testing was “inadequate to reduce or manage risks”.
Losses
There was no clear consensus on potential scale of loss, with views fairly evenly balanced across the potential range:
9.1% said <2.5%
36.4% said <15%
18.2% said <50%
36.4% said <100%
Observations and commentary
This scenario is clearly live already and operating at scale, although respondents still indicated only moderate use of AI, perhaps reflecting minimal losses attributable to self-driving car-related accidents to date. (Note: self-driving car systems fell within the LMA’s definition of AI for the purpose of this survey.)
Respondents were confident that exposure would also increase significantly in the near future, as drivers and passengers would be increasingly exposed to self-driving cars.
There was a lot of confidence in the testing regime applied by vehicle manufacturers and existing risk management practices, but still around a quarter of respondents were concerned that the existing processes were not enough to manage risks.
The viability rating was assessed as “plausible”, with a weighted score of 2.6 out of 5, indicating that the scenario is viable but is not necessarily expected to produce high-frequency losses. This may reflect an underlying tension between high-frequency exposure and strong risk management.
The magnitude rating was assessed as “moderate”, with a weighted score of 3.15 out of 5, indicating that there was clearly some potential for losses. However, respondents were split between views indicating low, medium and high claims values. Given losses in this scenario would be the product of injuries arising from motor vehicle accidents, it is perhaps reasonable to expect a relatively normal distribution of injury severity and correlated cost implications.
The overall impact of this scenario would also depend on the legal system in operation; in some jurisdictions (such as the UK[1]), motor insurers will be held liable for injury caused to drivers and passengers, meaning personal accident insurers that pay first-party claims may be able to subrogate against an at-fault party, which could significantly mitigate losses. Many jurisdictions are still considering the most appropriate method for injured parties to pursue legal recourse.
Scenario 10.1: “System downtime caused by AI malfunction and resulting in business interruption.”
Viability rating: Plausible (3.42 out of 5)
Magnitude rating: Minor (2.87 out of 5)
Overall impact rating: Moderate (9.82)
This scenario was intended to capture views from cyber insurance practitioners on insured losses that might flow from an insured’s system downtime, caused by malfunctioning AI. The precise cause of the AI error was not specified but the scenario implies that the AI deployment has a degree of system control or integration, to the extent that an AI error could cause a system failure that is sufficiently severe that business interruption losses occur.
Use of AI by insureds and growth potential
There were different views from respondents on the extent to which AI is currently being used by insureds in the way described in the scenario (i.e. integrated into an insured’s computer system to the extent that an AI error could take the system offline, causing business interruption losses). However, all respondents agreed that AI was currently in use, in this way, at least some of the time:
25% of respondents said that AI was already in use “in the majority of cases” and 25% said that AI was in use “in some cases”.
50% said “in a few cases”.
No respondents said that AI was not in use in the way described in the Cyber scenario.
There were mixed views from respondents on the degree of growth of the use of AI (in the way described in the scenario) over the next 12 months. 37% of respondents felt it was “very likely” that AI will be used more widely. However, there was some disagreement, with 25% of responses saying it was “somewhat unlikely”, and 25% saying “neither likely nor likely”.
There was stronger agreement about more widespread use of AI, in the way described in the scenario, over the next two-to-three years, with all responses indicating growth. 50% of respondents indicated AI was “somewhat likely” to grow and 50% indicated it was “very likely” to. These observations are very much in keeping with the total responses to this question across all scenarios, where 86% of all respondents agreed that growth in the use of AI was either “somewhat likely” or “very likely”.
Risk management
There were mixed views from respondents on how well they felt insureds were managing the risks of AI-caused system failure. Over half of responses expressed the view that it was likely that testing was being done in representative conditions prior to deployment, with 37.5% expressing it was very likely and 25% somewhat likely.
However, others thought it was neither likely nor unlikely (12.5%) or didn’t know (25%) whether the AI systems had been sufficiently tested.
However, there was a strong degree of confidence that existing measures were acceptable in most cases (37.5%) or adequate to reduce risk of scenario causing a major loss (50%). Only 12.5% of responses indicated that existing procedures were inadequate to reduce or manage the risks.
Losses
There was a mix of views on potential loss size arising from this scenario.
The modal average response was <15% of typical limits (37.5% of responses), indicating that over a third of respondents were not overly concerned about loss size.
However, 25% of responses indicated losses could be up to 50% of typical limits and 25% said losses could be up to 100% of limits.
On balance, the weighted average magnitude rating was 2.87 out of 5, labelled as “minor” on the magnitude scale.
Observations and commentary
This scenario probably goes beyond use of large language models. Sophisticated AI search engines and data analysis functions are not typically integrated with operational functions enough to cause a system failure. What is being contemplated here is the use of AI in a way that connects to core operational functions of an insured’s computer system (assuming the connection is deliberate) – scenarios that are perhaps more likely to arise in design or manufacturing settings. The way in which insureds use AI will vary considerably from case to case, depending on a wide range of factors, but it is interesting to note that all respondents agreed that there was at least some degree of risk of system failure posed by AI usage at present.
There was a wide range of views from respondents on key questions in this scenario, perhaps reflecting the breadth of the scenario and/or the wide range of complexity of the underlying risks. The issues arising may be better explored with a case study, where a precise event profile, wording and limits exposed could be reviewed in detail.
The viability rating for this scenario was “plausible” (3.42 out of 5), which sits in the middle of the viability scale, indicating that this type of loss scenario is a credible possibility but not “likely” or “very likely”.
The magnitude rating was “minor” (2.87 out of 5), indicating the view from respondents that this scenario could produce minor losses, with over a third of respondents suggesting a loss might scale at 15% of typical policy limits. However, it is noted that this score is very close to the next threshold (3 out of 5), which would have increased the rating to “medium”. There were also views from half of respondents fearing more substantial losses, indicating losses could be 50% or more of typical policy limits. It is difficult to estimate loss potential, as the values depend on so many different variables, but it is interesting to note the overall view that at least minor losses could arise from this scenario and also a sizeable proportion of respondents felt that losses could be much more significant.
The “plausible” viability rating of this scenario and mixed views on magnitude, averaging out as “minor”, led to an overall impact rating of “moderate” (9.82), although this score was at the lower end of that category. This overall rating perhaps reflects the general views of this scenario; a reasonably high potential of losses arising, moderated by strong confidence in risk management by insureds and an overall minor scale of losses expected per event.
Treatment of AI risk in model wordings
In 2024, the LMA undertook a review of the potential AI coverage position in the LMA’s suite of model cyber clauses. A summary table is provided in Annex 2, updated to include model cyber wordings published up to November 2025.
In this review, AI is recognised as a sub-set of software and therefore falling within the definition of Computer System, widely used in LMA model Cyber clauses:
Computer System means any computer, hardware, software, communications system, electronic device (including, but not limited to, smart phone, laptop, tablet, wearable device), server, cloud or microcontroller including any similar system or any configuration of the aforementioned and including any associated input, output, data storage device, networking equipment or back up facility, owned or operated by the Insured or any other party.
The potential AI coverage position, for each model clause, is indicated with a “low”, “medium” or “high” rating, based on assessment of whether the clause is:
Low: fully excluding cyber risks.
Medium: an exclusion of cyber risks with a write-back of cyber coverage or an affirmation of cyber risks coverage with a limitation.
High: a full grant of cyber coverage with no cyber-specific restrictions but subject to the other terms and conditions of the policy.
Disclaimer: The summary table in Annex 2 is intended to be indicative of potential AI (cyber) risk; the actual risks present in any contract will depend on the wording(s) used and the circumstances. The LMA accepts no liability to any party in respect of the information provided herein.
Annex
Annex 1: Full list of AI loss scenarios included in 2025 survey
The LMA and Lloyd’s Underwriting Talent Summit brought together 180 senior underwriting leaders to shine a spotlight on the trends impacting the pipeline of female underwriting leaders.
The event’s purpose was threefold: to share the lived experiences of female underwriting leaders, to identify the barriers slowing progression and to outline the clear steps that we can take forward as a market.
Below, we outline the individual actions that CEOs, CUOs and underwriting leaders can take to drive meaningful change to build the female underwriting leadership pipeline across our market.
CEOs and CUOs
Address the underlying cultural issue
Understand the lived experience of female underwriters in your company – their 5 to 9 shift; their experience of your entertainment events; their experience of comments and benevolent bias in your organisation.
Call out the inappropriate comments when you hear them.
Discourage those short-notice team drinks.
Check the guest list of your entertainment events: if there’s never more than one or two women there, change the type of the event.
Diversify your underwriting leadership
Who are the female underwriter role models in your organisation? If you don’t have any, go out and hire them.
If there’s only one female, check in with her. She might be exhausted from carrying the burden of trying to single-handedly represent the voice of every female underwriter in your organisation.
What is your 0-2 year and 2–5-year pipeline for female underwriters? Is it better than the 15% average? Is this a talent league table that you can and want to be top of?
Don’t forget the ethnically diverse viewpoint. Today, the combined male and female figure is about 7%, versus 46% ethnic diversity in London (2021 census).
Encourage sponsorship
Sponsorship means speaking up for them at promotions, introducing them to new networks, getting them opportunities to speak at big events (internal and external), bringing them into important strategic conversations, getting them involved in the overall Syndicate Business Forecast process.
Offer executive coaching.
Review succession planning and promotions
One leading managing agent spoke about how they promote twice as many people as they hire. Examine your promotion processes and have someone in the room who challenges the decisions made to ensure they are fair.
Promote for outcomes, not presenteeism, ‘executive presence’ or who hosts the most popular broker events.
Look at your 3–5-year pipeline and think about how you can build it. Let’s not exacerbate the problem into the future.
Revisit parental leave policies
Benchmark yourself against your peers and be ready to uplift that policy to give equal rights for men.
At a minimum, introduce 12 weeks of paternity leave fully paid and 6 months of maternity leave (best practice being both fully paid for 6 months).
Make both a day one of employment right.
Shout loudly about those men who take the full paternity leave – make them role models, particularly on your ExCo.
If a male member of your ExCo is about to become a father, strongly encourage him to take the full paternity leave and set an example for other men in the organisation.
Look at financial support measures you can take to support those with caring responsibilities, such as like paying for X days emergency childcare or elder care, or subsidised deals with national childcare chains.
Explore whether your organisation would participate in or advocate for a returner initiative. Commit to hiring from the programme once participants complete it.
Shift the conversation on flexible working
75% of women in our survey said flexible working arrangements have been pivotal in supporting them.
Judge by outcomes, not presenteeism – set women an objective but let them choose how they deliver it (e.g. new business target or team training).
Flexible working can take many forms over someone’s career – don’t be rigid in what it means. Instead, talk to the individuals about what could work for them.
Challenge the norms on travel and entertainment – one week per month to either the US or Asia is enough. Two nights of entertaining per week is enough. Finishing dinners by 8pm needs to become the norm. Set this standard yourself and role model this example.
Build a community
Work to build community amongst the female underwriters in your company and join up with other companies.
22 Bishopsgate, for example, brought together senior women in Hiscox, Beazley and Canopius to facilitate their network.
Underwriting leaders
Encourage conversations on flexible working
Speak up internally about what flexible working needs to look like for you, your teams and to support your life outside of work.
Normalise these conversations so people feel empowered to articulate what they need to thrive.
Create a structured support framework for parents
Put in place tailored support for pregnant underwriters and those taking adoption or paternity leave.
Consider matching them with senior parents who can guide them through the process and ensure they remain connected to P&L roles.
Prioritise their reintegration back into P&L positions when they return.
Encourage men to take their parental leave
Make it clear that men on your teams are supported to take their full parental leave entitlement.
Emphasise the importance of role modelling this and the positive cultural shift it creates.
Support an underwriting returner programme
Explore whether your organisation would participate in or advocate for a returner initiative.
Make sure leaders commit to hiring from the programme once participants complete it.
Broaden your talent pipeline
Look to insurance-adjacent industries and roles for senior women who could transition effectively into underwriting leadership.
This expands the pipeline and brings in fresh, diverse perspectives.
Encourage lateral moves within your organisation
Consider talent mobility and lateral transfers into underwriting teams.
This can unlock internal potential, give others a development opportunity and diversify future leadership.
Promote inclusive networking opportunities
Facilitate networking formats that don’t revolve around alcohol or sport.
Create spaces that allow a wider range of people to participate and build genuine professional connections.
Set boundaries on travel and social
Introduce clear expectations around travel (for example, no more than one week per month) and socialising (for example, a maximum of two evenings a week).
Support your teams to adhere to these boundaries to protect wellbeing and balance.